

It has been a while since I gave a proper written update on the Purple Meanie project. That doesn’t mean progress has stopped—quite the opposite. I’ve been working on it almost full-time. I even creep downstairs in the middle of the night to kick off another vibe when I think of something I should have taken into account.
The latest video sticks my head rather firmly above the parapet: I have rewritten the vehicle-control software from a clean sheet, using ChatGPT Codex as an agentic coding partner.
Before anyone asks: no, the new code isn’t open source yet.
It remains experimental, incomplete and tailored specifically to my car. If it reaches a point where I think it’s useful and responsible to release it, I intend to publish the parts that aren’t restricted by supplier NDAs. It isn’t ready for that today.
The New Video
Project sEVen pt 10: Project Update and Software re-write with AI
The the last video is a broad bench update but also video explains the new VCU code I’ve been working on:
Why start again?
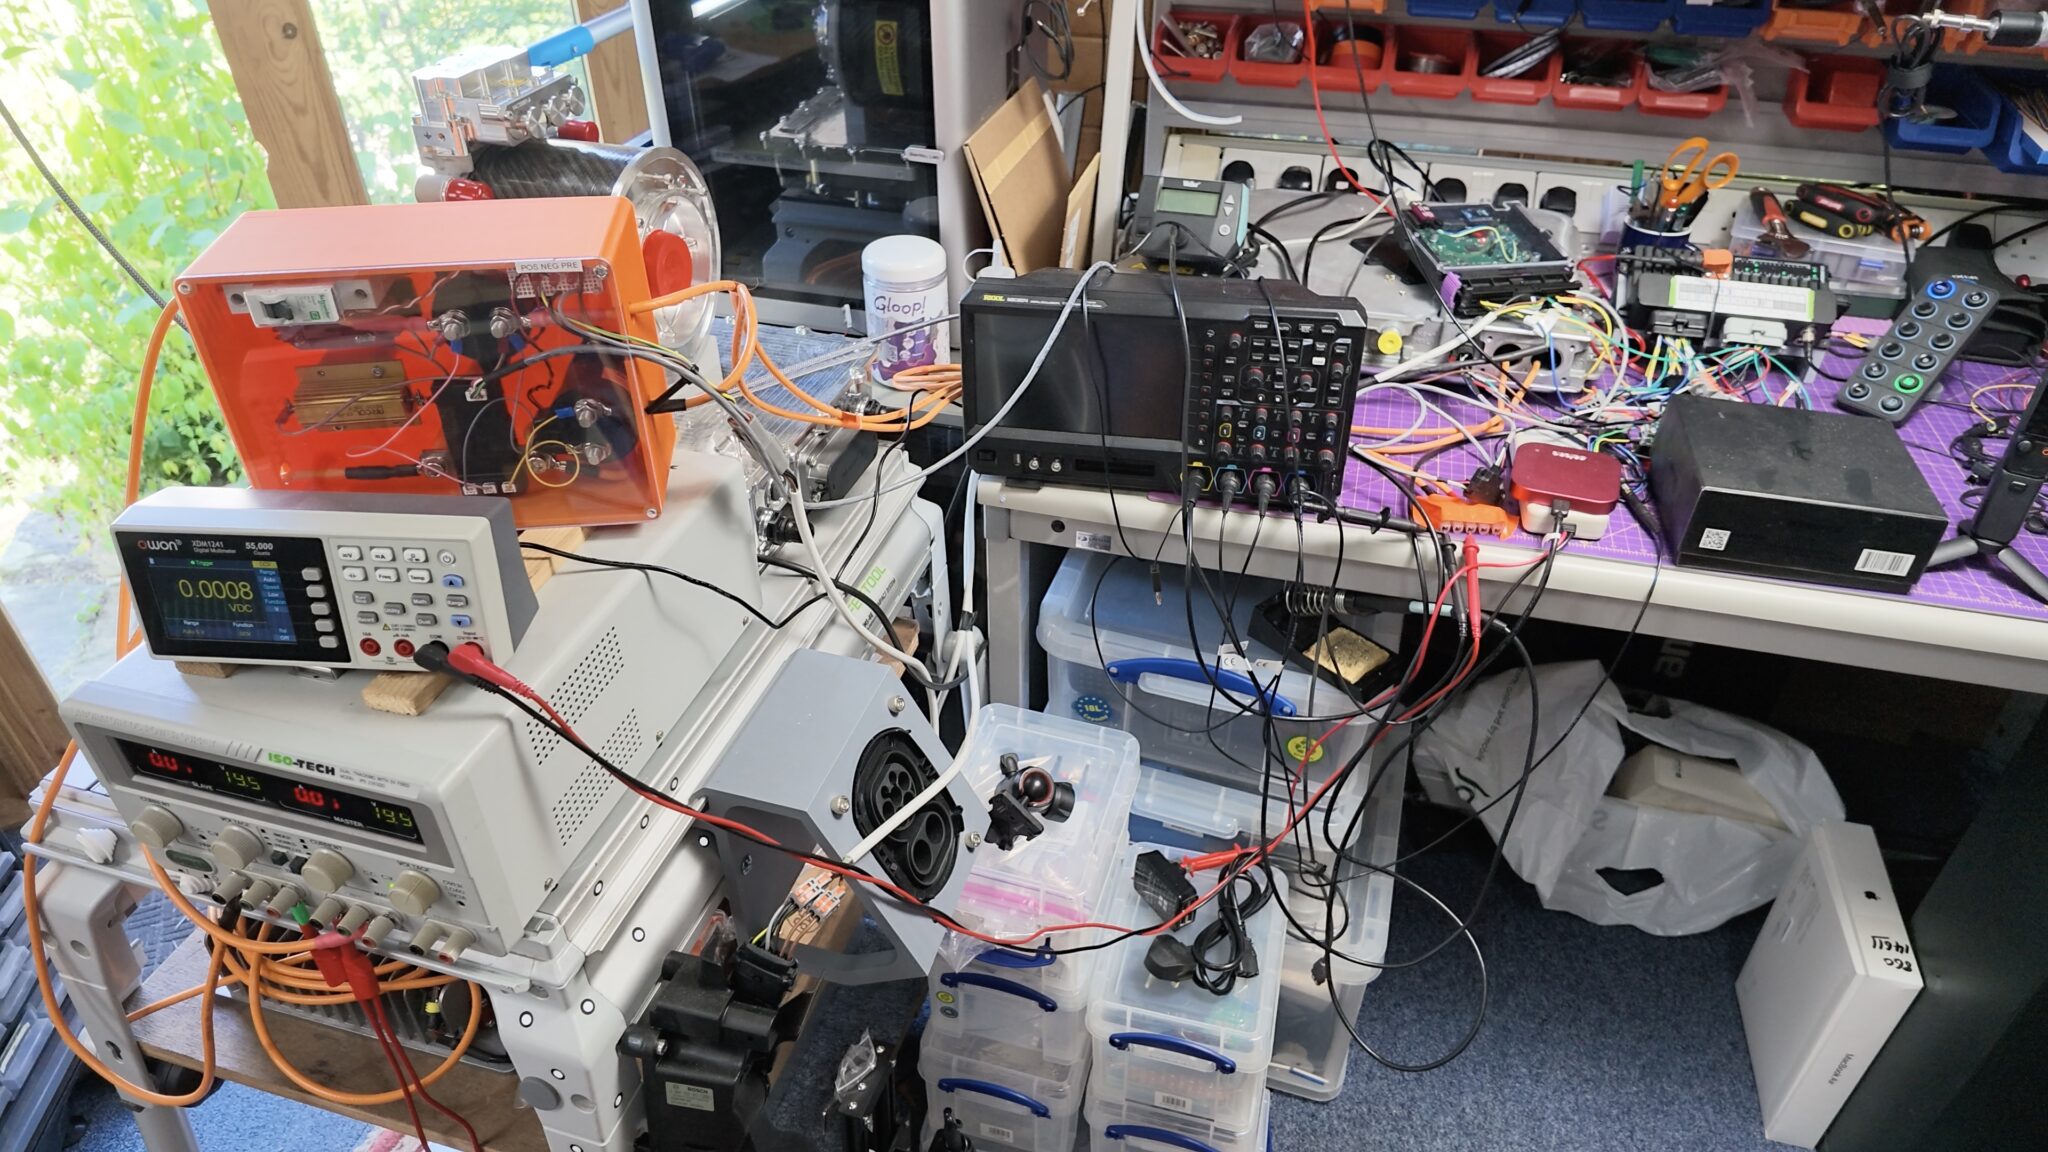
My Caterham has an unusual high-voltage architecture. It has both a low-side and a high-side HV bus, connected by a bidirectional traction DC-to-DC converter.
I had incorporated this into the open-source ZombieVerter software and had it substantially working. The problem wasn’t that the existing software couldn’t support it. The problem was that I didn’t like the architecture I was creating as my project diverged further from the original system.
My folly was then while I was away for a weekend, I decided to find out what Codex could do with a clean sheet of paper. I’d done over a dozen AI related coding projects over the previous 6 months and finally thought it was time to see if a safety critical, high speed, don’t chuck John in a ditch project could be vibe coded… what could possibly go wrong!
To be clear, the new implementation doesn’t copy the existing ZombieVerter application software or its old web interface. The ZombieVerter hardware remains, and the proven behaviour of the original system is an important reference—particularly for safety-related sequencing—but the new application architecture and implementation started from scratch.
After four weeks, 28 development phases and a fairly spectacular number of tokens, I had the system shown in the video running on the bench.
That is both exciting and slightly terrifying.
What’s been built?
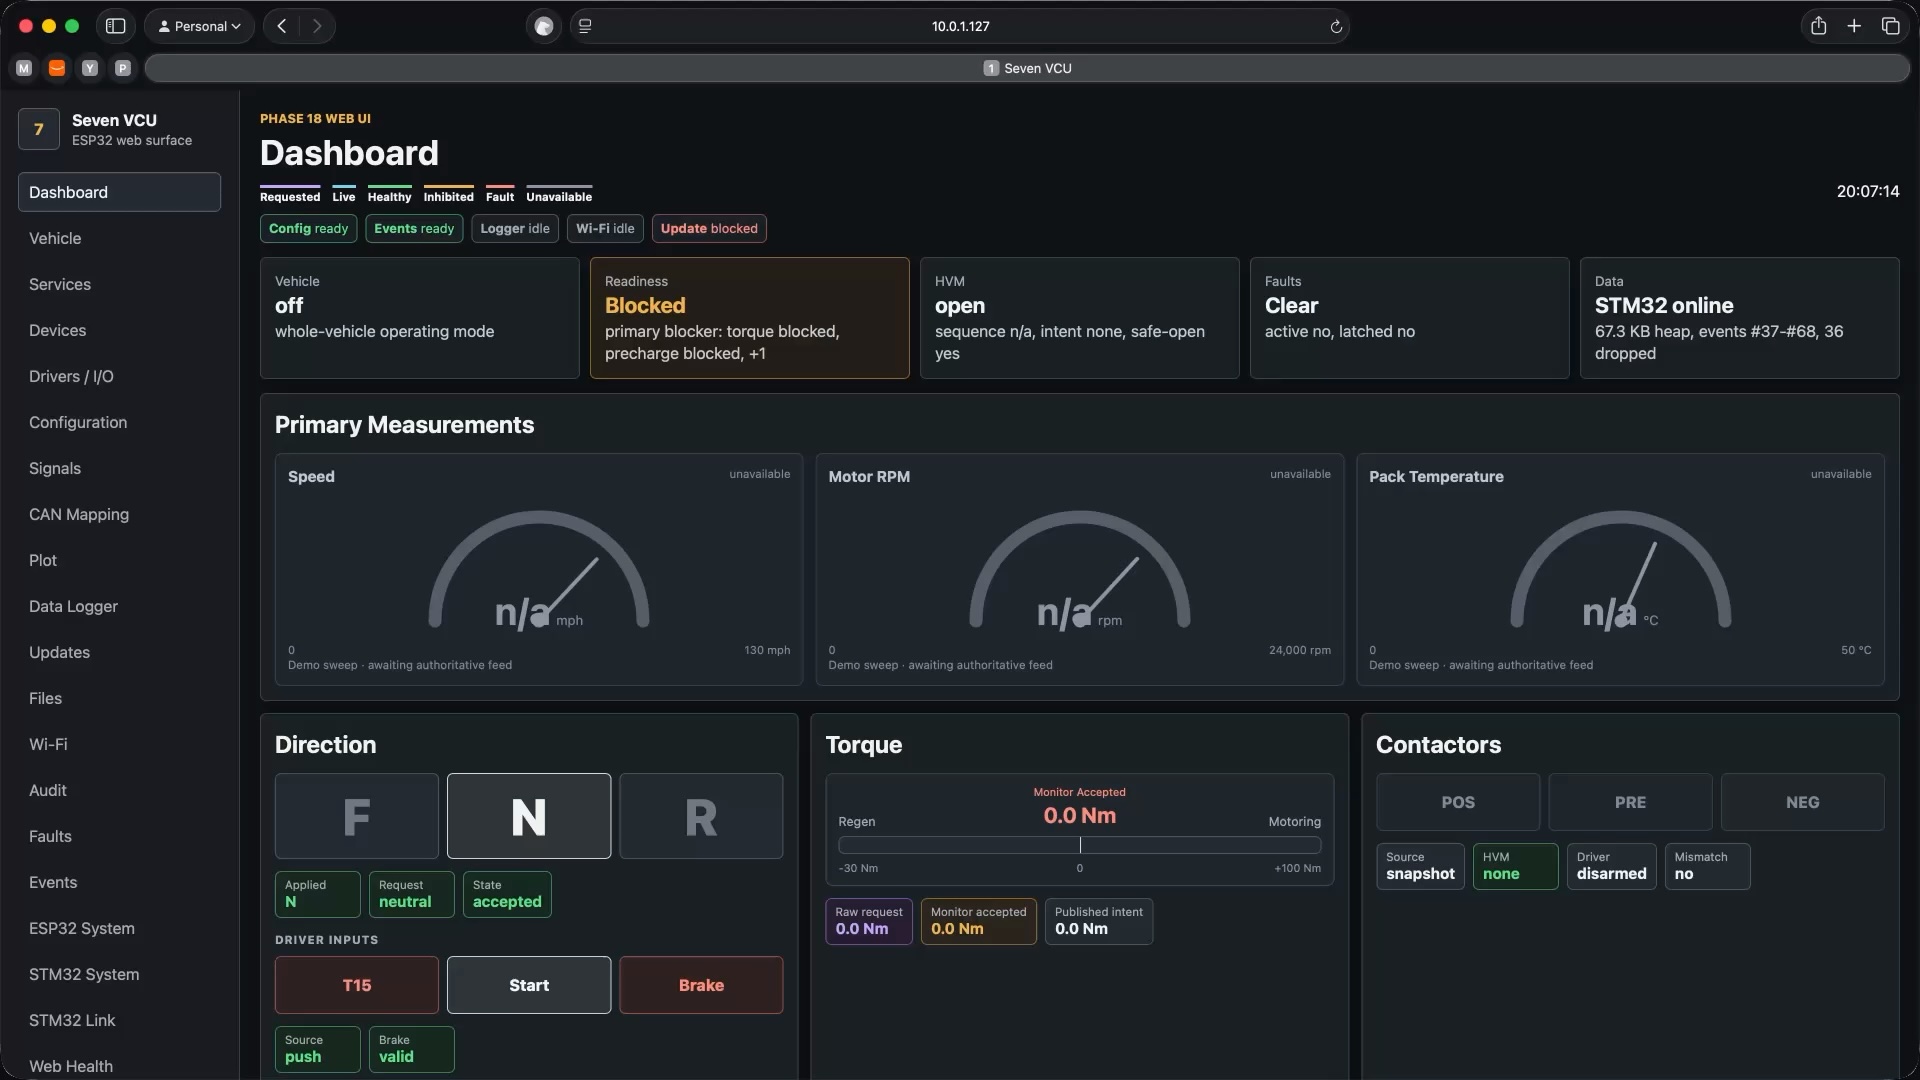
The system uses the STM32F107 on the ZombieVerter board as the authoritative vehicle controller. An ESP32-S3 daughterboard provides the web interface, command-line terminal, logging and other communications facilities.
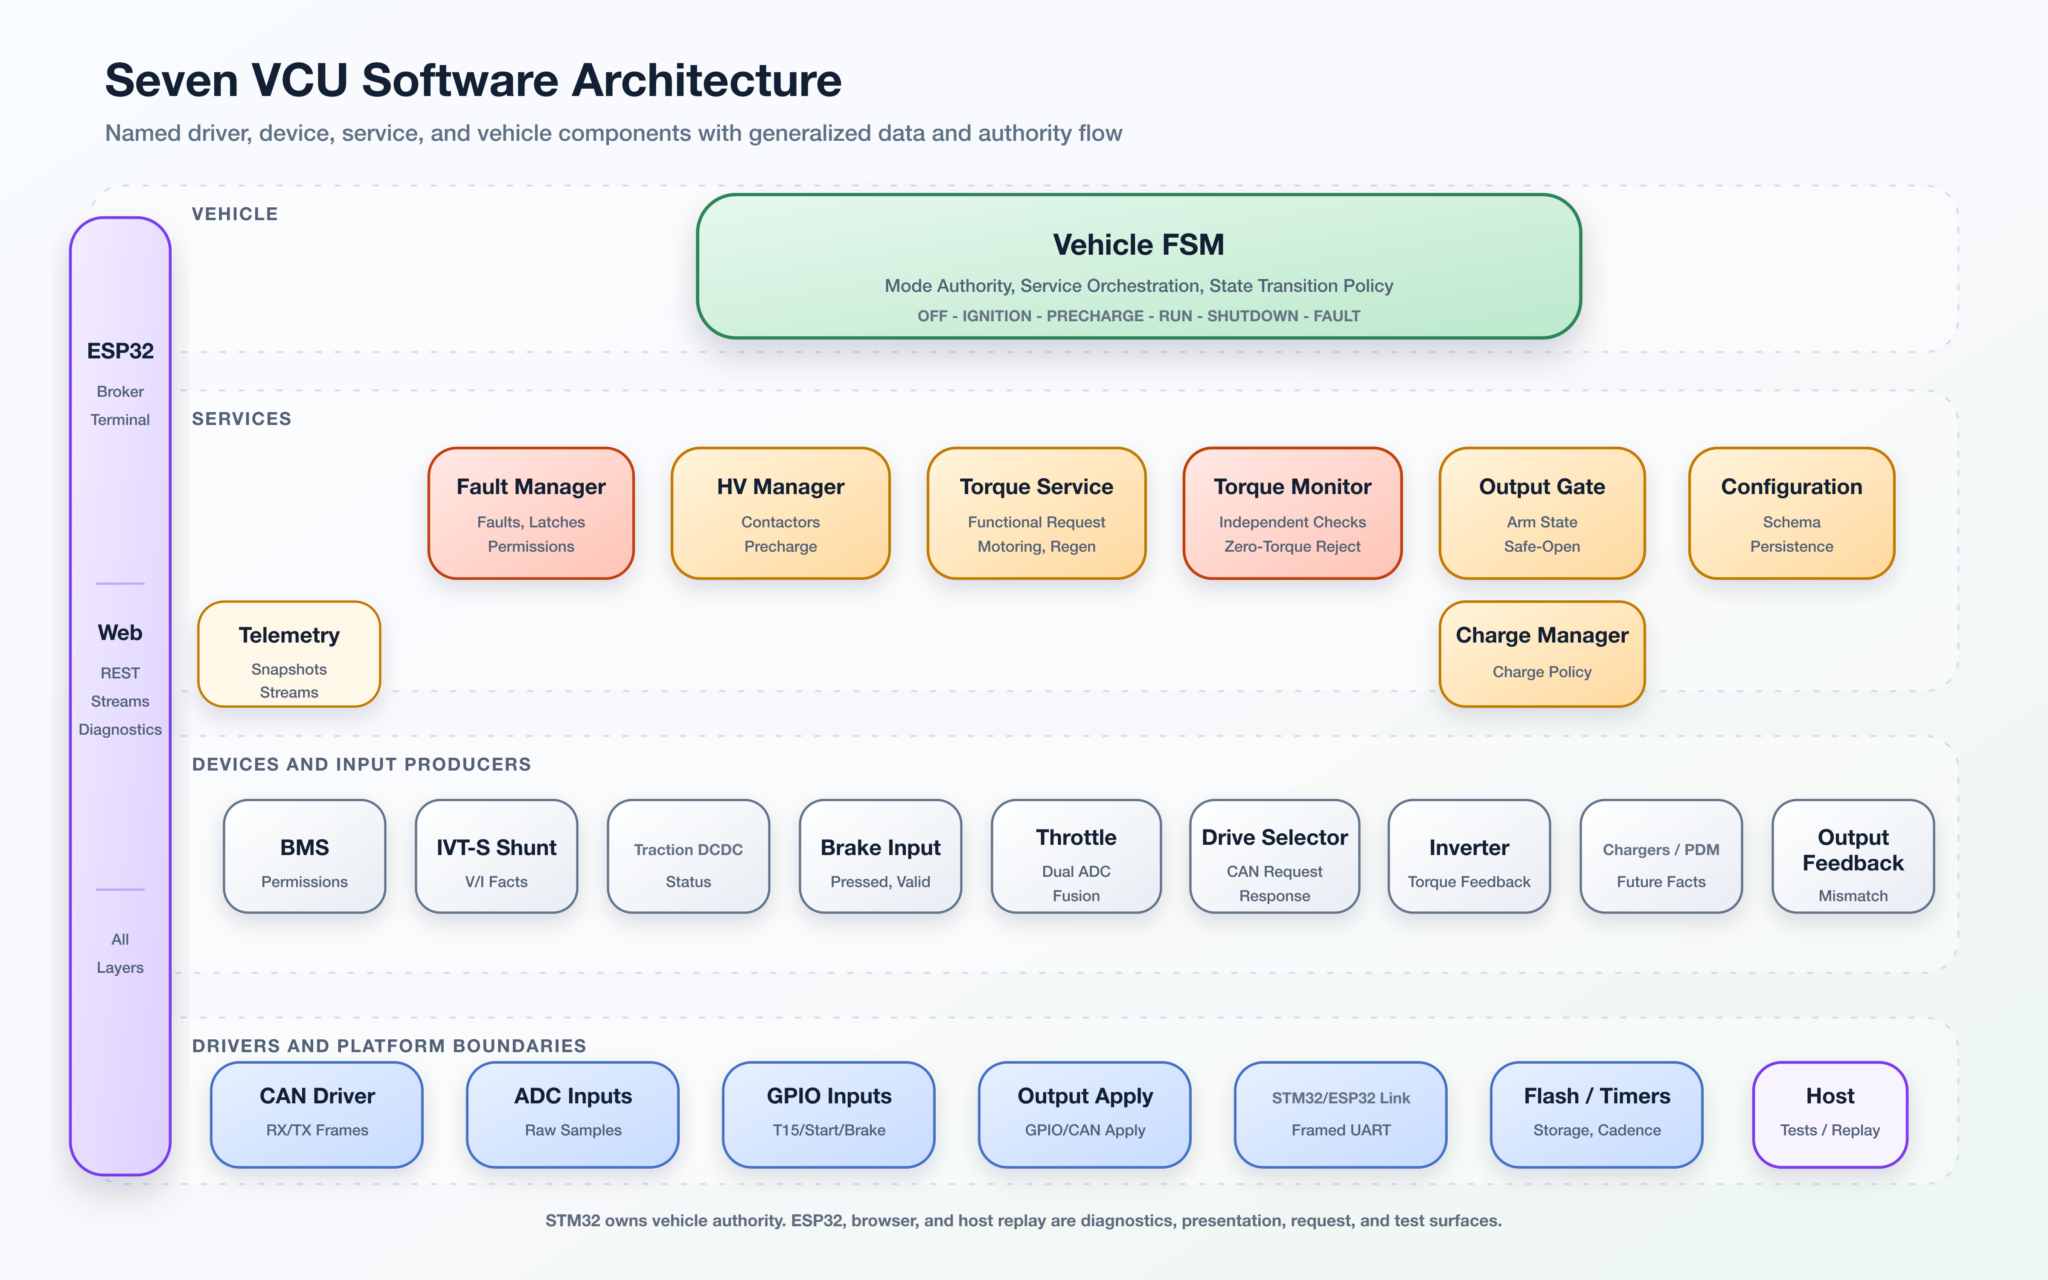
The STM32 must remain capable of controlling the vehicle safely if the ESP32 is absent, rebooting, overloaded or being reprogrammed. The browser and ESP32 are therefore observation and request surfaces, never the authority for vehicle behaviour.
The STM32 software is organised into four broad layers:
- Drivers deal with pins, ADCs, CAN controllers, timers and communications hardware.
- Devices interpret hardware data and publish facts about components such as the IVT-S shunt, throttle and drive selector.
- Services own functions such as high-voltage sequencing, torque decisions, fault handling and configuration.
- The Vehicle finite state machine owns the overall operating mode.
Time-sensitive hardware input uses interrupts and DMA where appropriate, but the interrupt handlers do not run vehicle policy. They capture, timestamp, queue and notify. Safety decisions remain in deterministic task-context code where they can be tested and reviewed.
The ESP32 runs its own FreeRTOS tasks and provides two main ways to observe the system.
The first is a web interface containing the Dashboard and detailed Drivers, Devices, Services and Vehicle views. It also provides configuration, signals, plotting, logging, system diagnostics, events and fault information.
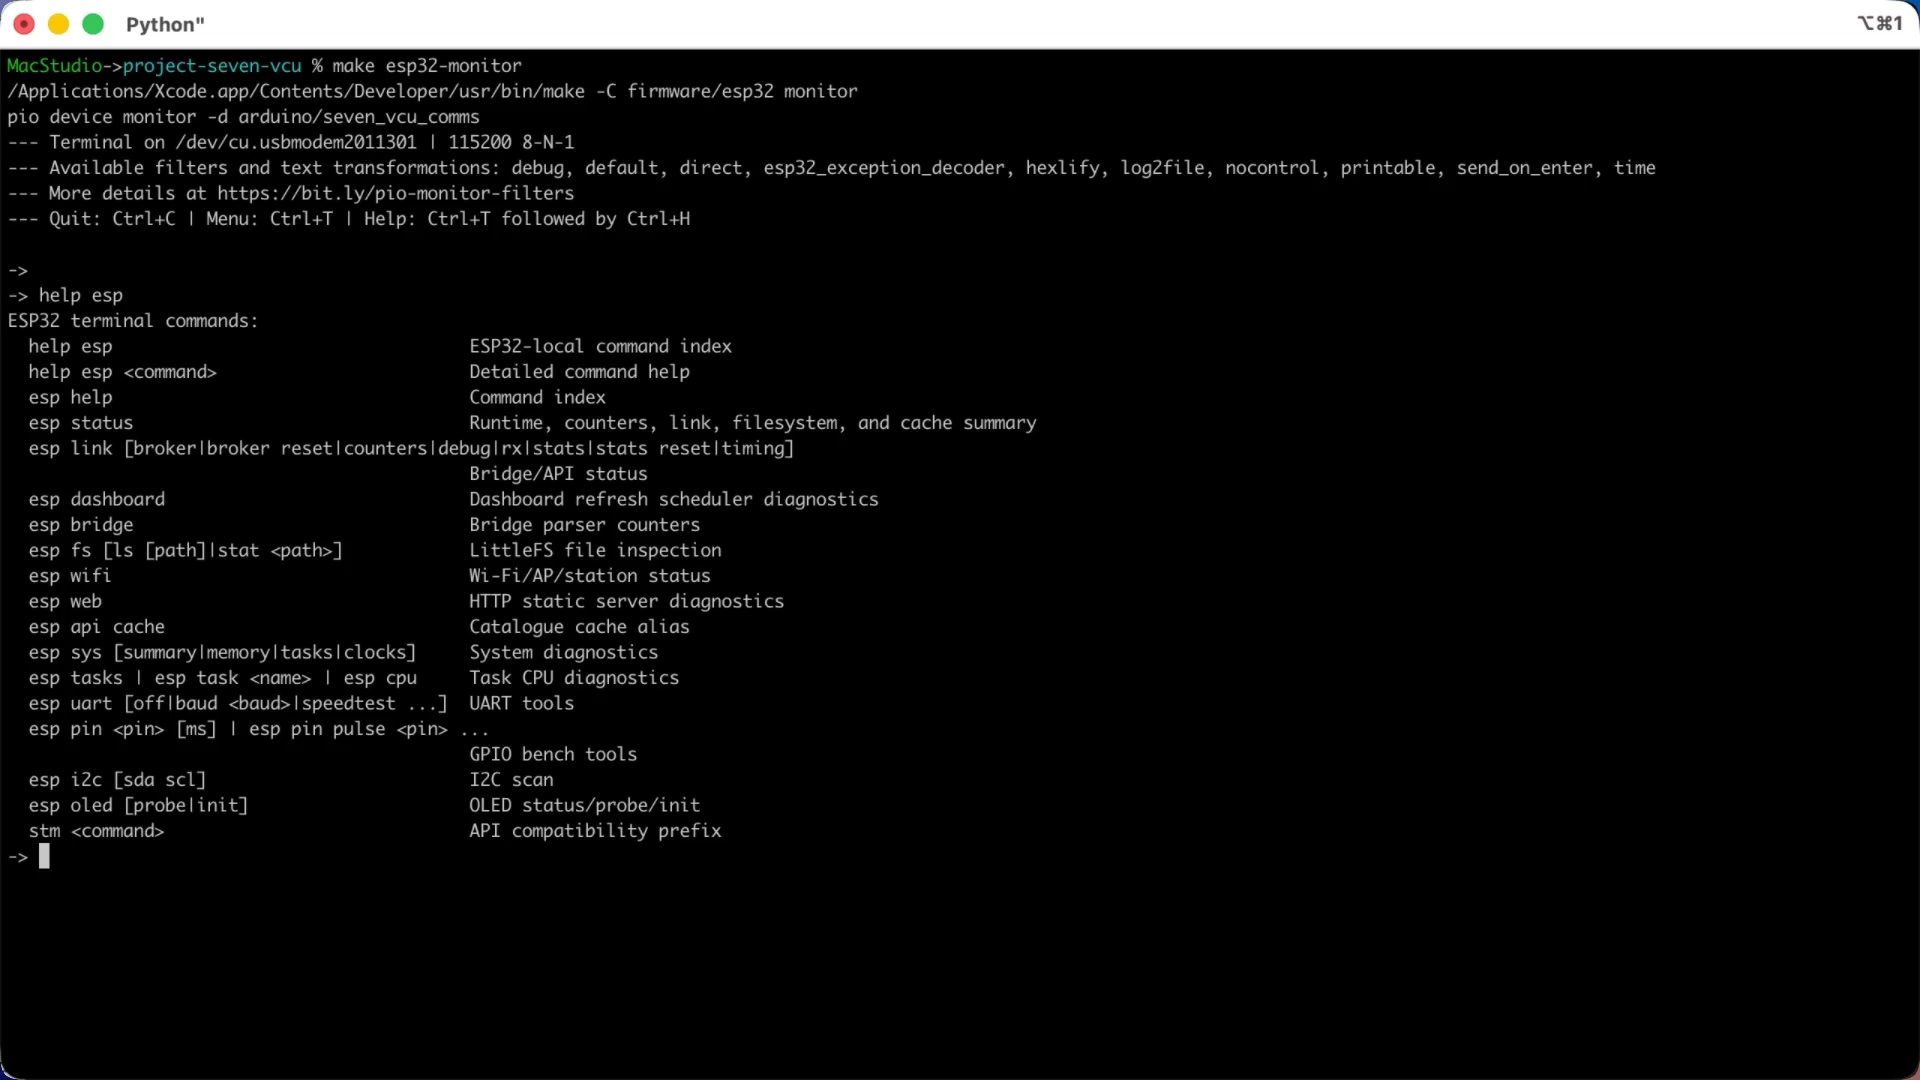
The second is a command-line terminal. This allows me to inspect the system in much greater depth, including task execution, processor use, link performance, subscriptions, inputs, outputs and service state.
Compact binary link
The STM32 and ESP32 communicate over a one-megabit serial connection using a bounded binary protocol.
At startup, the STM32 reports the checksum and generation of its operator catalogue. If the ESP32 doesn’t have the matching catalogue in its cache, it retrieves a new copy.
The catalogue describes the public fields, identifiers, types, units, views and commands that the ESP32 needs. Once that metadata is known, normal telemetry can be transferred using compact identifiers and binary values rather than repeatedly sending field names or JSON.
Telemetry is subscription-based. The ESP32 maintains a small operational baseline and requests additional data according to what an operator or connected browser needs.
Continuously changing values—voltages, currents, ADC measurements and throttle position—use bounded sampled streams. State transitions and status changes can be sent on change. Ordered events, where sequence and loss matter, remain separate from latest-value telemetry.
If there is no connected browser, the higher-detail browser subscriptions aren’t needed. If the ESP32 is completely absent, none of this prevents the STM32 from operating the vehicle safely.
Safety and diagnostic behaviour
Every device fact has explicit validity and freshness.
A voltage of zero is not used to mean “missing,” “invalid” or “stale.” These are separate states. If the IVT-S shunt stops communicating, for example, its data becomes stale and the owning services can remove permission or initiate the appropriate safe response.
The High Voltage Manager owns contactor sequencing and the low-side and high-side precharge process. The Fault Manager independently evaluates faults and can veto unsafe operation.
The Torque service calculates the requested torque, while a separate Torque Monitor checks that decision using an independent set of bounds and safety conditions.
Real inverter torque production is not enabled yet. The current torque path is diagnostic and zero-safe until the real inverter, speed, availability, BMS limits and other required facts have proper owners and validation.
The IVT-S installation also provides the measurements required for future weld detection. The algorithm exists, but it isn’t yet part of the active control loop.
Testing something this large
The project has a host-side test harness that runs the shared control logic on a Mac without requiring the vehicle hardware.
This lets me test state machines, contactor sequencing, stale and invalid device data, queue pressure, request rejection, fault behaviour and other safety-related cases deterministically.
Selected tests also generate timing diagrams. These aren’t attractive diagrams drawn afterwards to explain what I hoped the software would do. They are generated from structured test traces, which means I can inspect the ordering of inputs, decisions, state transitions and output intent produced by the test.
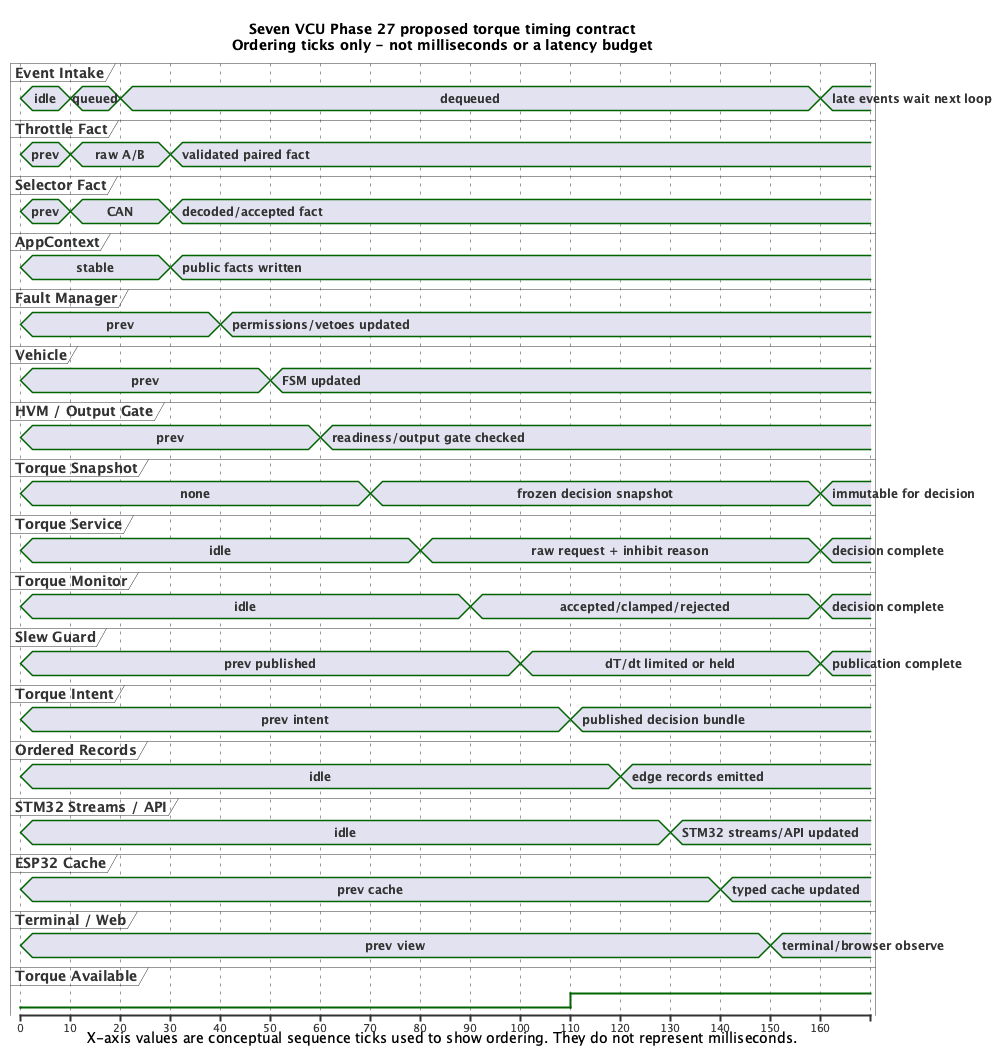
Automated tests are only one part of the evidence. Firmware builds, browser tests and structural checks are also run during development. Codex can flash the boards, access the terminal and probe the web interface, so a surprising amount of integration diagnosis can be automated.
Hardware validation remains my responsibility. I review the results and perform the staged tests on the bench. Anything involving contactors, high voltage, real CAN devices or physical output behaviour requires hardware evidence before I trust it.
My agentic development workflow
“AI wrote it” doesn’t adequately describe what is happening.
Nor do I give Codex a one-line instruction to “build me a VCU” and return later to find a finished vehicle controller waiting for me.
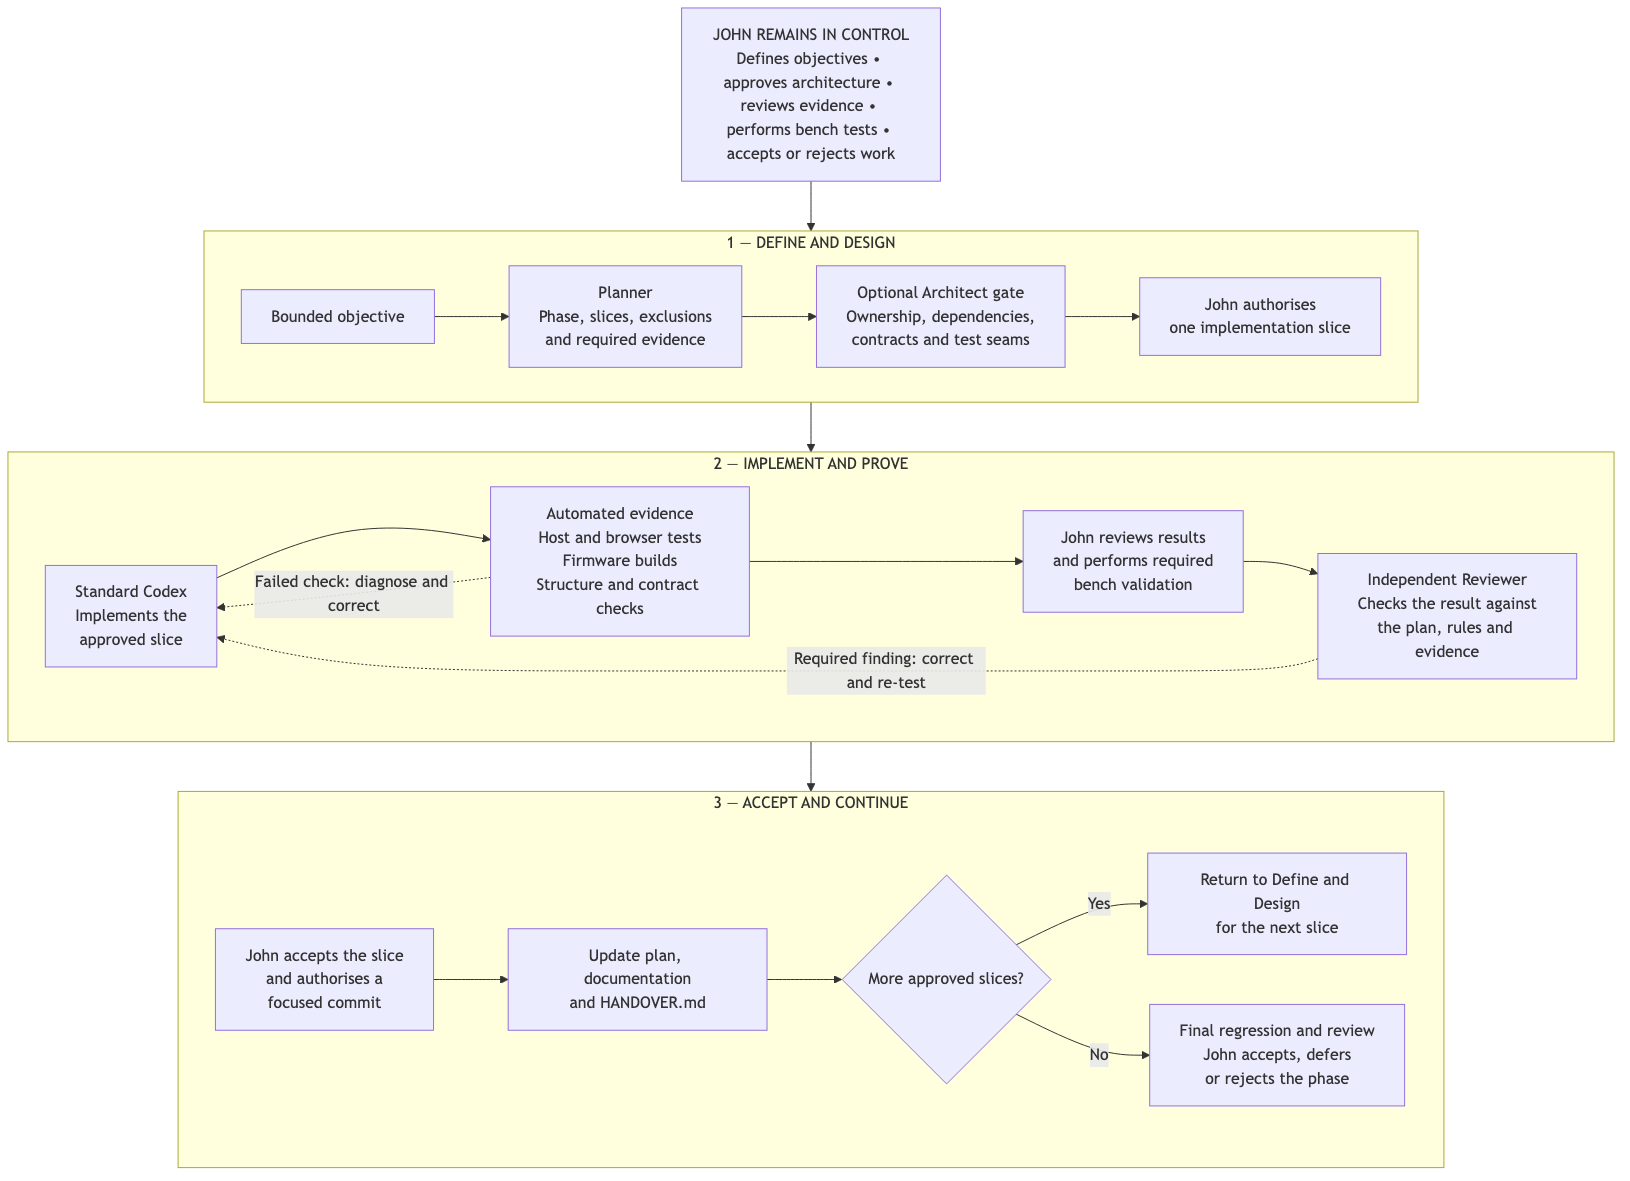
The process is structured, supervised and deliberately evidence-heavy. It evolves as I learn what works, but the current version looks like this.
Here’s the workflow as a flowchart (it’ll change… of course)…
What’s it Cost?
Lots and lots and lots of tokens.
I started off on the free ChatGPT plan a year ago then upgraded to the $20/mo plan. But then Codex got released at the end of last year and things changed.
I was doing more and more AI coding projects. Stuff I’d had in the back of my mind for years, but I didn’t want to spend 6 months developing. But Codex changed all that.
And to be clear Claude Code will do just as good a job. It and Codex are good at their own specialities. I like Codex, but that’s not to say you couldn’t do what I’ve done with Clause Code. Pick your poison!
Back to the costs.
After burning through my $20/mo tokens, I soon jumped to the $100/mo plan. That might sound a lot to some people. But you have to remember that a High Voltage Amphenol connector can easily cost that. Spening $100 a month on having a whole software development team at my beck-and-call is a bargain.
I did also bump up to the $200/mo plan for a while. Just to get some thorny issues resolved on a tight timescale (even retired people have timescales). But I could drop back to the $100 plan once that was over.
Then there’s the time cost. In the 4 weeks in question, I did a bunch of vibing. Because I could do it at the test-bench or on the sofa, I was at it every waking second. Seven days a week. I could set it off doing something simple and leave running while I did chores around the house or went for a walk. But it was doing something while I was off doing life. So it was way more than 40 hours a week – just like running a start-up again! 🤣
A Note on Current AI
There’s lots to be said about AI coding at the moment. And I don’t have space to do that justice here. But one thing I will say is that vibe coding (agentic coding with AI) is not a fix-all problem.
For sure some people have got good results from vibing even when they’re not software engineers. But the key thing is that you need to understand your problem-space.
I’ve been coding real time software for over 45 years and running software development teams for more than 35 years. To me AI coding is like being a CTO – you guide the project at that level.
AI goes and does the work of a team of dozens of engineers, but you have to have the critical problem-space questions that you can apply to the AI as it works its problems. It’s just like being a CTO.
1. Persistent project memory
The project doesn’t rely on one enormous chat history.
A compact HANDOVER.md records the current state, active phase, next action and important warnings. README.md provides the human entry point. AGENTS.md tells a new Codex task which documents to read and which working rules take precedence.
Stable architecture and engineering decisions live under docs/. Detailed work is broken into phase plans under plans/.
This lets a fresh task build the necessary context from the repository rather than depending on what an earlier conversation happened to remember.
2. A phase begins with a bounded objective
I decide on the next coherent piece of work: support a device, change a task boundary, add a diagnostic path, or address a structural problem.
When a genuine planning pass is needed, I explicitly invoke the Planner role. It turns the objective into a proposed phase with bounded slices, tasks, validation requirements, exclusions and exit criteria.
A future inverter phase, for example, would not simply be called “make the motor spin.” It would identify the real inverter facts, command ownership, safety gates, staged bench tests and conditions under which torque output must remain inhibited.
The plan is then reviewed and revised with me. I decide whether the phase is accepted and whether it should begin.
There’s a real phase markdown file attached at the end of this post.
3. Architecture is treated as a gate where necessary
Material changes may start with an architecture gate.
The Architect role examines ownership, dependency direction, task boundaries, public contracts, test seams and where the code should physically live. It can propose documentation and planning changes, but it doesn’t silently expand the project or start implementing production code.
Not every small change needs an architecture ceremony. The role is invoked when the decision genuinely concerns architecture.
4. Standard Codex implements one approved slice
Once a plan is accepted, a normal Codex task carries out the implementation.
It works through one approved slice at a time. It inspects the existing owners, makes the smallest coherent change, runs the required checks and records the evidence in the plan.
Codex is already good at normal software implementation, so I don’t wrap that work in an elaborate fictional “coding agent” persona. The repository rules, active plan and local architecture provide the harness.
Source structure is enforceable. Broad composition files aren’t allowed to become the default home for new behaviour. Structural checks flag oversized files, legacy hotspots and selected dependency violations.
5. Automated evidence is gathered as part of the slice
Depending on the work, Codex may run:
- host unit and regression tests;
- deterministic replay or fault-injection tests;
- STM32 and ESP32 firmware builds;
- browser tests;
- source-structure checks;
- protocol and contract fixtures;
- resource and firmware-size comparisons;
- live terminal and web probes; and
- carefully bounded board flashing and bench diagnostics.
A failed check isn’t quietly described as “probably fine.” It remains a failed check or a recorded limitation.
6. I perform the manual validation
Once the automated work is complete, I review what changed and carry out the required bench testing.
The agents don’t mark manual bench validation complete on my behalf. I own that evidence, along with slice acceptance and phase closure.
The system stops after each slice. It doesn’t autonomously continue into the next area of work just because more checkboxes exist.
7. Independent review is genuinely separate
For selected slice or phase gates, I invoke a Reviewer in a separate Codex task.
The Reviewer doesn’t inherit the implementation discussion and isn’t supposed to rationalise what the implementation task intended. It examines the result against the plan, architecture, safety rules and evidence.
It reports required findings separately from optional improvements. Any required findings go back through the normal implementation and validation process.
The Reviewer doesn’t decide that the project is accepted. That remains my decision.
8. Commit, hand over and repeat
After a coherent slice is complete and accepted, I authorise a focused local Git commit. That creates a checkpoint I can inspect or return to if later work goes wrong.
The plan and handover documentation are updated, and only then do I authorise the next slice.
When all slices are complete, the phase receives its full regression and review pass. I then decide whether to accept and close it.
Suggested image: a simple workflow graphic showing: Idea → Plan → Architecture gate → Implement → Automated checks → Bench validation → Independent review → Accept and commit. Place “John” across the whole flow to emphasise continued human control.
What do I actually do?
I’m involved throughout.
I choose the objectives, review the plans, make the architecture and safety trade-offs, watch the work, answer questions, examine the evidence, perform the bench testing and decide whether each slice is accepted.
I often watch Codex work. A chunk usually takes minutes rather than hours, so it isn’t like watching paint dry. Seeing which files it examines, what assumptions it makes and how it reacts to test results is informative, and I can steer it while it works.
The AI produces code much faster than I could type it, but typing speed isn’t the difficult part of vehicle-control software. The difficult parts are deciding what the system should do, assigning authority, controlling failure behaviour, preserving determinism, proving the important paths and knowing what hasn’t yet been validated.
Those responsibilities have not been delegated.
Is 81,000 lines of code completely bonkers?
Possibly. Probably. Definitely!
That figure includes the STM32, ESP32 and web application, and reflects a large amount of diagnostic and operator functionality. There is at least as much written material again in plans and durable technical documentation.
A high line count is not automatically evidence of either quality or waste. It does, however, increase the cost of inspection and maintenance.
For instance, the phase following the video release is going to be a behaviour-preserving source-boundary cleanup. Its purpose is to reduce duplicated lifecycle logic and move accumulated responsibilities out of large integration files without changing the vehicle, protocol or safety behaviour.
Even that cleanup has a baseline slice, frozen contracts, structural evidence and an architecture gate before production files are rearranged.
Why not simply stay with ZombieVerter?
The established ZombieVerter codebase has years of community experience and testing behind it. My new implementation doesn’t.
That is a serious limitation, not something that AI makes disappear.
However, my vehicle architecture and software were diverging substantially from the original project. Much of the code I would eventually have created around that divergence would also have required its own testing.
Starting again gave me an architecture I understand and which directly represents this car. It also gave me the opportunity to build host testing, replay, explicit validity and freshness, diagnostics and documentation into the project from the beginning.
I’m not proposing this as a replacement for ZombieVerter, and I’m not currently building a generic controller into which anyone can drop arbitrary components. The architecture may allow that direction in the future, but today the implementation is deliberately specific to my vehicle.
What happens next?
The video captures a significant milestone, but not a finished VCU.
The immediate work includes more testing and source-boundary cleanup. After that come the real inverter integration, motor feedback, BMS and energy limits, final torque publication and carefully staged attempts to make the motor turn.
There is still a very long distance between “works on my bench” and “trusted in the car.”
For now, though, the contactors sequence, the traction DC-to-DC converter produces its 260-volt high side (which is what I’m asking for at the moment – it will be 800V in the finished bench and vehicle), the VCU observes the system through its new web and terminal interfaces, and the clean-sheet architecture has proved that it can run on the real hardware.
Four weeks earlier, it was a blank page on a laptop at a campsite.
I’m looking forward to seeing where it goes next.
Am I crazy? Probably.
Is it over-engineered? Of course. That’s what I do.
Let me know what you think—and happy blatting.
Bonus Material
Completed Phase Plan
Here’s a recent phase plan to re-work the way the web interface was serving content. This isn’t meant to be read verbatim, it’s to give a flavour of the work that goes into creating a plan and working through it… this is NOT me issuing a fire-and-forget order for Codex to go and implement some random output.
# Phase 28: Web Panel Information Design

Status: complete as of 2026-07-14. The 13 bounded Services, Devices, and
Drivers migrations in Slices 28.41-28.53, the Vehicle-page follow-on in Slices
28.60-28.63, Dashboard rework, and CAN hardening are implemented and reviewed.
Post-close live-data regressions found on 2026-07-15 were resolved without
reopening the phase: ESP32 WebSocket send recovery was hardened and STM32
contactor intent/applied changes now trigger `output_gate_state` publication.

## Goal

Make browser panels easier to scan without hiding the distinction between
inputs, internal decisions, outputs, faults, freshness, validity, and detailed
diagnostics.

The phase should produce a small reusable presentation system, prove it on the
Torque / Drive Permissions, Drive Selector, and Traction DCDC panels, and leave
a clear bug/deferred-work record for later expansion. It is deliberately a
quick web-polish phase, not a site-wide rewrite.

## Why This Phase Exists

Phases 26 and 27 made the browser faster, denser, and substantially more
complete. As more real facts have appeared, however, panels have accumulated
many visually equivalent chips. A categorical state, a measured voltage, an
input request, an applied output, a stale source, and a fault reason can all
look like peer values even though they mean different things.

The browser needs a predictable visual grammar. An operator should be able to
look at any device or service panel and quickly answer:

- what came in;
- what the STM32 decided or is doing internally;
- what went out;
- whether the evidence is valid and fresh;
- what is blocking, degraded, or faulty;
- where to find raw counters, timestamps, source, and transport details.

## North Star

Each detailed live panel follows the same hierarchy where the underlying data
supports it:

```text
Panel header: name | overall condition | freshness/age | optional source

Inputs              Internal state / decision        Outputs
requested facts  -> validation, mode, permission -> applied/published facts

Condition strip: faults | vetoes | inhibits | stale/invalid evidence

Diagnostics drawer: raw values | counters | sequence | timestamps | cache/feed
```

Not every panel needs every region. Empty structure must not be rendered merely
for symmetry, and unavailable data must not be invented.

## Scope

Included:

- Audit the current Torque / Drive Permissions, Drive Selector, and Traction
  DCDC panels and map each displayed fact to input, internal state/decision,
  output, condition, freshness/validity, source, or detailed diagnostics.
- Define reusable browser components and CSS for panel headers, stage groups,
  compact metric rows, signal rows, condition strips, freshness/age indicators,
  source tags, permission matrices, counter pairs, and diagnostics drawers.
- Retain chips for categorical state such as mode, permission, validity,
  freshness, and fault reason; render numeric values as aligned dense metrics
  rather than large chips.
- Use state rails only for real state machines, not for arbitrary collections
  of enum values.
- Prototype the shared grammar on:
  - Services -> Torque / Drive Permissions;
  - Devices -> Drive Selector;
  - Devices -> Traction DCDC.
- Preserve live stream/cache updates, initial hydration, source/freshness
  meaning, unavailable/no-feed behavior, tooltips, and mobile layout.
- Add or update local browser tests for the shared components and the three
  prototype panels.
- Run browser/board smoke checks and record rendering, update, and regression
  evidence.
- Maintain a short Phase 28 bug/deferred-work list. Fix small defects in the
  touched presentation path; defer unrelated data-source, firmware, and broad
  page issues to an explicitly named later phase or follow-up.

Out of scope:

- A site-wide migration of every panel before the prototype is reviewed.
- A new browser framework, build system, navigation model, or visual brand.
- Changes to STM32 authority, control policy, safety decisions, or CAN/device
  behavior.
- New STM32 instrumentation or new data feeds solely to make a prototype look
  complete. Missing data should be shown honestly and recorded for later work.
- Reworking configuration, logger, files, Wi-Fi, update, or other workflow
  pages that do not use the live device/service panel grammar.
- Making colour the only indication of state.
- Broad backend optimisation or stream-rate work unless a regression in the
  touched panels demonstrates a concrete need.

## Information And Colour Rules

- Panel headers summarize overall condition; they do not repeat every detail
  shown in the body.
- Inputs, decisions, and outputs use stable placement and explicit labels.
- Numeric values use aligned label/value/unit rows. Chips are reserved for
  categorical facts and short, meaningful states.
- Requested intent and applied/published result must remain distinguishable.
- Faults, vetoes, inhibits, stale state, and invalid evidence remain visible
  without opening a drawer.
- Raw protocol values, counters, sequence numbers, timestamps, cache details,
  and low-level source evidence may move into the diagnostics drawer.
- Green means healthy/valid; blue or cyan means active/selected/energised;
  amber means inhibited/stale/degraded; red means fault/unsafe; grey means
  inactive/unavailable/not implemented; purple may distinguish requested
  intent from applied state.
- Every coloured state also has a text label, icon, shape, or accessible title.
- `live`, `snapshot`, `static`, `unavailable`, and `not implemented` retain the
  Phase 26 meanings everywhere.
- A benign inactive state must not look like missing data, and unavailable
  evidence must not look healthy merely because no fault is asserted.

## Slice 28.00 Existing Panel Audit And Prototype Contract

- [x] Inventory the three current panels, their render functions, shared UI
  helpers, CSS, endpoints/topics, hydrate sources, and live-update paths.
- [x] Classify every displayed field by information role and identify duplicate,
  ambiguous, incorrectly prominent, and drawer-worthy facts.
- [x] Record the proposed shared component API and responsive layout contract.
- [x] Capture before-state screenshots or equivalent browser evidence at
  representative desktop and narrow widths.
- [x] Confirm that the prototype requires no new STM32 instrumentation.

Exit criteria:

- The three panels have an explicit field/role map and an agreed implementation
  shape before presentation code is generalized.

## Slice 28.10 Shared Panel Grammar And Components

- [x] Implement the smallest reusable HTML/JavaScript helpers needed for the
  header, input/decision/output stages, dense metrics, condition strip, and
  diagnostics drawer.
- [x] Implement shared CSS tokens and responsive behavior without duplicating
  panel-specific styling.
- [x] Preserve semantic labels, keyboard access, tooltips, and colour-independent
  status meaning.
- [x] Add component-level browser assertions where practical.

Exit criteria:

- The primitives can express all three prototypes without hard-coding one
  panel's field names or hiding unavailable/error states.

## Slice 28.15 Torque State And Sampled Stream Split

- [x] Replace the overloaded `torque` on-change stream with distinct
  `torque.state` and `torque.sampled` streams while retaining the existing
  structured Torque snapshot for explicit terminal/API reads.
- [x] Keep service/monitor modes, decisions, reasons, effective limits, regen
  gates, and published-intent availability in the on-change state stream;
  carry continuously changing counters and timestamps with the sampled values.
- [x] Publish raw, monitor-checked, monitor-accepted, and published torque
  values through a bounded latest-value sampled stream at 20 Hz by default.
- [x] Merge both compact topics into one browser torque model so Dashboard,
  Services, Signals, Plot/Gauge, and terminal stream diagnostics retain their
  current field names and distinguish accepted request from published intent.
- [x] Raise the per-browser subscription capacity from 12 to 16 so both torque
  topics remain part of the normal profile without displacing diagnostics or
  other device streams.
- [x] Verify initial subscription hydration, independent state/sample
  freshness, bounded UART/WebSocket traffic, and recovery after both firmware
  endpoints restart.
- [x] Bench-verify live Forward pedal movement through `torque.sampled` on both
  shared signed graphs.
- [x] Record the forward rule that newly integrated devices with both
  low-rate state and continuously changing measurements receive separate
  `.state` and `.sampled` streams at design time; do not retrofit a combined
  stream after browser surfaces depend on it.

Exit criteria:

- Live Forward bench torque movement reaches both shared signed graphs through
  `torque.sampled`, state/reason changes remain event-driven through
  `torque.state`, and neither stream is mistaken for inverter-applied torque.

Bench evidence, 2026-07-13:

- STM32 and ESP32 production firmware flashed with operator catalogue
  generation 41; browser assets synchronized over STA.
- `torque.state` hydrated once and remained `current` after 45 seconds quiet;
  `torque.sampled` was accepted at 50 ms and delivered all 11 numeric fields.
- Sixteen STM32 subscriptions were active with zero publisher drops,
  coalescing, malformed requests, sampled sequence gaps, or malformed torque
  updates after restart.
- In live Run/HV-ready/Forward operation the terminal snapshot and sampled
  cache agreed at 418 deci-Nm accepted with a 21 ms cache age. The remaining
  graph issue was traced to the browser startup list omitting both torque
  topics; automatic `torque.state` and `torque.sampled` subscription is now
  covered by the browser regression test and deployed with a new asset version.
- Operator verification confirmed live torque movement on both the Dashboard
  and Services graphs after the automatic-subscription fix.
- Host tests: 35/35 passed. Local browser tests: 9/9 passed. Production STM32
  and ESP32 builds passed; the live Services page loaded without application
  asset failures or page errors (the existing optional `/favicon.ico` request
  remains absent).

## Slice 28.20 Three-Panel Prototype

- [x] Convert Torque / Drive Permissions so raw/requested torque and permission
  inputs, service/monitor decisions, effective limits, published intent,
  compile/runtime regen gates, and inhibit/fault reasons have distinct roles.
- [x] Convert Drive Selector so request, acceptance decision, accepted mode and
  direction, response/counter evidence, freshness, and decline/stale reasons
  read as one input-to-output flow.
- [x] Convert Traction DCDC so measured inputs, requested/actual operating state,
  commands/feedback, high/low-side values, warnings/faults, freshness, and raw
  diagnostics are grouped by meaning rather than rendered as equal chips.
- [x] Preserve initial hydration and granular live update behavior on all three
  panels.
- [x] Record bugs found during the conversion and fix only those inside the
  touched presentation/data-binding path unless a wider fix is clearly small
  and safe.

Exit criteria:

- The three panels use the shared grammar, remain live, and show all previously
  useful facts either in the main hierarchy or the diagnostics drawer.

## Slice 28.30 Browser, Bench, And Responsive Evidence

- [x] Run local web tests and update stable DOM/semantic assertions for the
  prototype panels.
- [x] Build the ESP32 web/firmware target as required by the touched files.
- [x] Sync or flash the board and run the existing web probe against the live
  surface.
- [x] Verify hydrate then live-update behavior for the three panels without
  full-page refreshes or multi-second action lag.
- [x] Inspect desktop and narrow/mobile layouts for clipping, unstable height,
  excessive empty space, and unreadable density.
- [x] Confirm faults, inhibits, invalid/stale state, and no-feed/unavailable
  cases remain conspicuous and text-labelled.
- [x] Check WebSocket/link/CPU diagnostics for an obvious regression caused by
  presentation changes.

Exit criteria:

- Local and live-board evidence shows the prototypes are readable, responsive,
  semantically correct, and do not regress the existing dataflow.

## Slice 28.40 Remaining Panel Migration Audit

- [x] Audit the Services, Devices, and Drivers browser pages for remaining
  chip-based panels that could use the adopted information grammar.
- [x] Produce one explicit inventory entry per candidate panel, including its
  page and displayed title, render function/component, hydrate source, live
  topic or cache path, and principal information roles currently shown.
- [x] Exclude the three adopted prototypes and distinguish true panel-grammar
  candidates from workflow forms, navigation/status summaries, tables, logs,
  plots, and panels that already have a more suitable presentation.
- [x] Identify duplicate, obsolete, unavailable-only, or overlapping panels
  that should be removed or consolidated instead of mechanically migrated.
- [x] Note known data/feed gaps separately from presentation work so a panel
  migration does not invent facts or silently expand into device integration.
- [x] Estimate the final candidate count (currently expected to be roughly 16),
  group the list by browser page, and propose a sensible review order.
- [x] Review the inventory with the operator and agree the exact bounded list
  of panels to address.
- [x] After that agreement, add one numbered Phase 28 slice per accepted panel;
  do not create or begin those implementation slices during this audit.

Exit criteria:

- The remaining web surface has been audited, each migration candidate is
  named and scoped, exclusions and consolidations are explicit, and the
  operator has agreed the list from which individual panel slices will be
  created.

### Audit Result

The page DOM contains exactly 16 remaining surfaces after excluding the three
adopted prototypes: Services -> Torque Service, Devices -> Drive Selector, and
Devices -> Traction DCDC. The common live panels hydrate from `/api/dashboard`
and merge the compact topics named below through `stm32Status()` or
`stm32Shunt()`. Configuration and UART summaries instead use
`/api/stm32/link`; Dashboard Stream is browser/WebSocket client state rather
than an STM32 domain model.

| Page | Panel | Current renderer and data path | Principal roles | Proposed disposition |
| --- | --- | --- | --- | --- |
| Services | HVM | `stateRailHtml()` + `hvmDetailPanelHtml()`; dashboard hydrate; `vehicle`, `outputs`, `traction_dcdc.state`, `traction_dcdc.sampled`, and `shunt.sampled` | HVM state/intent, output gate, sequence, safe-open, high/low-side voltage | Migrate; strong input/state/output/condition candidate. |
| Services | Fault Manager | `stateRailHtml()` + `faultPanelHtml()`; dashboard hydrate; `vehicle`, `permissions`, and `outputs` | clear/active/latched state, class, action/owner, shunt validity | Migrate; keep active conditions visible and move ownership detail into diagnostics. |
| Services | Charging | charging rail + `unavailablePanelHtml()`; no implemented charging feed | intended state, path, enable, inhibit | Defer until charging integration publishes facts; an unavailable-only restyle adds little value. |
| Services | Configuration Service | `setKeyValueTable("configState")`; `/api/stm32/link` summary cache | cache health, schema/generation, key/storage counts, last error | Adapt to the grammar as an authority/state/condition summary, not a forced three-stage flow. |
| Services | Dashboard Stream | `renderDashboardStreamState()`; local WebSocket/dashboard state and `liveSignalStats` | client mode, correlation, age, heap, sent/drop or topic count | Adapt to compact transport status/metrics/diagnostics; it is not a vehicle input/output flow. |
| Devices | Throttle | `throttlePanelHtml()`; dashboard hydrate; `throttle.sampled`, `analog_inputs.sampled`, and digital-input cache | channel/fused input, validity/freshness, released/deadband state, fault reason | Migrate; retain the fused-position bar and expose both channels as measurements. |
| Devices | BMS | `bmsPanelHtml()`; dashboard hydrate; BMS facts currently carried by `digital_inputs.state` | source, freshness, discharge/charge permissions, coverage | Migrate honestly as partial/fake-source coverage; pack data and faults remain integration work. |
| Devices | Shunt | `shuntPanelHtml()`; dashboard hydrate; `shunt.sampled` | V1/V2/V3, current, power, completeness/validity | Migrate; dense measurements plus freshness/validity and raw diagnostics. |
| Devices | Inverter | `inverterCommandPanelHtml()`; dashboard hydrate; `torque.state`, `torque.sampled`, and `outputs` | VCU intent/demand, monitor decision, inhibit intent/applied, missing feedback | Migrate as a clearly partial VCU-to-inverter path; do not imply device feedback exists. |
| Devices | Chargers | `unavailablePanelHtml()`; no OBC/DCFC feed | intended charger states and limits | Defer until charger integration publishes facts; keep the current honest placeholder meanwhile. |
| Devices | PDM | `pdmSelectorPanelHtml()`; dashboard hydrate; `digital_inputs.state` | selector-only source/freshness, request/acceptance, RX counters, coverage | Migrate as partial PDM coverage while keeping it distinct from the VCU Drive Selector decision panel. |
| Drivers | CAN | `setKeyValueTable("driverCanState")`; dashboard CAN hydrate, no granular CAN live topic | interface/IRQ state, RX/TX, FIFO/ring/dispatch, decoder and selector-TX counters | Migrate; use state/traffic/health groups with counters in engineering details. |
| Drivers | GPIO | `analogInputPanelHtml()`; dashboard hydrate; `digital_inputs.state`, `digital_inputs.diagnostics`, `analog_inputs.sampled`, and `analog_inputs.diagnostics` | digital inputs, raw ADC measurements, capture/DMA diagnostics | Migrate; retain analogue bars and separate live inputs from capture health. |
| Drivers | Output Drivers | output-gate rail + `unavailablePanelHtml()`; dashboard hydrate; `outputs` | runtime/physical gate, feedback mismatch, request activity | Consolidate with Intent / Applied Feedback into one migrated Output Drivers panel. |
| Drivers | STM32 / ESP32 UART | `setKeyValueTable("driverUartState")`; `/api/stm32/link` | link state, RX/TX frames and bytes, rejected frames, API error | Adapt to link-state/traffic/condition/diagnostic groups rather than a three-stage device flow. |
| Drivers | Intent / Applied Feedback | `setCompactChips()`; dashboard hydrate; `outputs` | contactor and torque-inhibit intent/applied pairs, safe-open | Merge into Output Drivers; it is the missing command/feedback body of that panel, not a separate device. |

Known data gaps are deliberately outside these presentation slices: charging
service state, OBC/DCFC state and limits, real BMS pack measurements/faults,
inverter ready/enable/actual-torque/fault feedback, wider PDM channels/loads/
faults, and output physical-application facts not yet published. The CAN panel
also lacks a granular live topic and currently follows dashboard hydration;
that does not block its visual migration and should not trigger new
instrumentation in this phase.

Recommended bounded implementation list: 13 slices covering HVM, Fault
Manager, Configuration Service, Dashboard Stream, Throttle, BMS, Shunt,
Inverter, PDM, CAN, GPIO, combined Output Drivers, and STM32 / ESP32 UART.
Defer the two unavailable-only Charging and Chargers surfaces, and fold Intent /
Applied Feedback into Output Drivers. Suggested execution order is: (1) HVM,
Throttle, Shunt, CAN, and GPIO as the richest live-data examples; (2) Fault
Manager, combined Output Drivers, Inverter, BMS, and PDM as decision/partial
device panels; then (3) Configuration Service, Dashboard Stream, and UART as
non-flow status adaptations.

Operator decision, 2026-07-13: accepted the recommended 13-slice list and its
two deferrals/one consolidation. Services -> Charging and Devices -> Chargers
remain unchanged until their owning integrations publish real facts. Drivers
-> Intent / Applied Feedback will be removed as a separate surface when its
content is folded into Drivers -> Output Drivers.

### Migration Implementation Contract

This contract applies to every slice from 28.41 through 28.53:

- Panel-specific JavaScript may classify and map authoritative facts into the
  shared panel model, but must not reproduce layout scaffolding or responsive
  behavior.
- Use and extend the existing shared primitives (`informationPanelHtml()`,
  `informationStageHtml()`, metrics, condition strips, state rails, disclosure
  handling, analogue bars, and signed graphs) rather than creating parallel
  panel-local markup systems.
- Shared presentation behavior belongs in `core.js` and shared styling belongs
  in `styles.source.css`; generated bundle/CSS files remain build outputs.
- Do not add a panel-named CSS selector for spacing, columns, chip sizing,
  colour, diagnostics, or breakpoints when the requirement can be expressed by
  an existing role or a small reusable modifier.
- If a panel exposes a genuinely new visual relationship, add the smallest
  reusable primitive or role/modifier and demonstrate that it is not tied to
  one panel's field names.
- Keep per-panel renderers declarative and limited to labels, values, roles,
  states, source/freshness meaning, diagnostics, and optional shared visuals.
- During each slice, check for duplicated markup/style rules and remove retired
  panel helpers or selectors once their final consumer has migrated.
- Browser tests should assert the common semantic roles and responsive
  contract, with panel-specific assertions limited to data mapping and safety-
  meaningful labels/states.

## Slice 28.41 Services HVM Panel

- [x] Recast HVM state, intent, output gate, sequence, and safe-open evidence
  into the shared meta/state/output/condition hierarchy.
- [x] Present high- and low-side voltages as dense live measurements with
  source, freshness, and validity meaning preserved.
- [x] Move raw sequence, stream/cache, shunt cross-check, and other engineering
  evidence into the persistent diagnostics drawer.
- [ ] Verify hydrate, live HVM transitions, unavailable/stale rendering, and
  narrow-width layout without changing HVM authority or policy.

Exit criteria: HVM reads as one state-and-output flow, retains every useful
fact, and remains live and responsive at desktop and mobile widths.

Local evidence, 2026-07-13: Services HVM now maps facts declaratively into the
existing shared `informationPanelHtml()` primitives; no new CSS or layout
helper was added. Compact `vehicle`, `outputs`, `permissions`, and Traction
DCDC updates exercised the state, intent, gate, contactor intent/applied,
fault/blocker, and high/low-voltage paths. The 390 px regression confirms the
shared flow stacks to one column without overflow. Local browser tests passed
9/9 and the production LittleFS image build passed. Board hydrate/transition/
stale review remains before the slice is complete.

Initial board evidence: the cache-bundled asset was synchronized without a
firmware flash; all 4 applicable board tests passed with 5 fixture-only tests
skipped, and the live Services probe had no page errors or failed application
resources. Visual review in Vehicle Off/HVM Open confirmed a clear condition,
fresh on-change source, valid shunt evidence, Open rail state, Not ready state,
armed output gate, safe-open output, and no HVM blockers. That review also
caught and fixed an initial semantic leak where the generic vehicle helper
treated torque inhibition as an HVM blocker. Live HVM transitions and a stale
source still require operator/bench review.

A subsequent T15-off bench check exposed that the headline voltages were
sourced from cached Traction DCDC values. The HVM panel now preserves all four
distinct measurements in electrical-path order: battery pack from shunt V2,
low side from shunt V1, Traction DCDC low side, and Traction DCDC high side.
Each source carries its own availability presentation; inactive DCDC readings
are `n/a` rather than stale values. Shunt V3 (the future low-side-negative
node) remains an engineering detail. Six live board samples at two-second
intervals showed both shunt-backed values changing with shunt freshness live.

## Slice 28.42 Devices Throttle Panel

- [x] Recast both throttle channels, fused demand, released/deadband state,
  freshness, validity, and fault reason into the shared hierarchy.
- [x] Retain the responsive fused-position bar and show both normalized channel
  measurements without promoting raw ADC counts over operator facts.
- [x] Place raw ADC, timestamps, stream/cache, and capture detail in engineering
  diagnostics while keeping disagreement/invalid state conspicuous.
- [ ] Verify hydrate and live pedal movement plus released, stale, invalid, and
  narrow-width cases.

Exit criteria: channel plausibility and fused pedal demand are immediately
clear without losing the raw evidence needed for bench diagnosis.

Implementation evidence, 2026-07-13: the Devices Throttle panel now uses the
shared information-panel hierarchy and the shared analogue bar, extended only
with a reusable display-label option. Channel and fused demand are operator-
facing percentages; per-mille values, raw ADC counts, timestamps, stream
sources, and ADC capture counters remain in Engineering Details. Local stream
fixtures cover released/deadband, disagreement/invalid, stale, and narrow-
width rendering. All 10 local browser tests pass. A live T15-off board probe
confirmed fresh valid channels, active released deadband, a zero fused output,
live raw ADC/capture diagnostics, and no browser errors. Live pedal travel and
physical invalid-channel review remain for bench verification.

## Slice 28.43 Devices Shunt Panel

- [x] Present V1/V2/V3, current, and power as aligned live measurements rather
  than equal categorical chips.
- [x] Make source, freshness, completeness, and validity visible in consistent
  meta/condition positions.
- [x] Move raw values, timestamps, and stream/cache evidence into engineering
  diagnostics.
- [x] Verify dashboard hydrate, `shunt.sampled` updates, stale/unavailable
  behavior, signed values, units, and narrow layout.

Exit criteria: the shunt panel is measurement-dense, semantically honest, and
updates cleanly from its existing sampled stream.

Completion evidence, 2026-07-13: the Devices Shunt panel now uses the shared
information-panel hierarchy with aligned Voltage and Electrical Flow stages.
Condition, freshness, validity, source, completeness, and sample currency use
the common semantic positions; raw units and stream/cache counters are in
Engineering Details. Local fixtures cover unavailable hydrate, signed values,
invalid/incomplete data, the six-second stale transition, and 390 px layout.
All 11 local browser tests pass. After runtime asset sync, six live board
samples showed V1/V2/V3/current updating from the push stream with valid,
complete, current state, signed values, no failed resources, and no page
errors.

## Slice 28.44 Drivers CAN Panel

- [x] Group interface/initialization state, traffic, queue/ring health, dispatch,
  decoder, and selector-response evidence by role.
- [x] Keep bus-off/error/overflow/failure conditions conspicuous and move bulk
  counters and high-water details into engineering diagnostics.
- [x] Preserve the current dashboard hydrate path without adding a granular CAN
  stream or implying more live cadence than exists.
- [x] Verify available/unavailable states, counter updates, and responsive
  density using local and board evidence.

Exit criteria: CAN health and traffic can be scanned quickly while detailed
driver counters remain reachable and accurately sourced.

Completion evidence, 2026-07-13: the Drivers CAN panel now uses the shared
information-panel hierarchy with Interface, Traffic, and Routing roles.
Present interface readiness is kept distinct from cumulative TX/FIFO/overflow
failure history, while queue, ring, dispatch, decoder, and selector-response
counters remain available under Engineering Details. Missing selector-response
counters are shown as `n/a` rather than healthy zeroes, and the source is
explicitly identified as a dashboard snapshot rather than a granular CAN
stream. The full 13-test local browser suite passes with focused available and
unavailable CAN coverage, including the 390 px layout check. After runtime
asset sync, six board samples showed focused-dashboard
rehydration from a stale 2617-second snapshot to 40 ms and subsequent RX, TX,
dispatch, and shunt-decoder counter movement, with no failed resources or page
errors.

Cadence refinement, 2026-07-14: all page fallback rows now request one update
per second, while the Balanced profile requests 200 ms for its faster live
topics, including `torque.sampled`. Page navigation explicitly subscribes the
matching Dashboard, Services, Devices, Drivers, Faults, or System fallback row.
View leases now express demand only and no longer introduce a hidden producer
period; STM32 sampled and snapshot periods are derived from accepted web
subscriptions. The live profile smoke confirmed 200 ms accepted periods for
digital, analogue, throttle, torque, shunt, and Traction DCDC sampled producers,
with Traction DCDC state correctly remaining edge-driven at period zero.

## Slice 28.45 Drivers GPIO Panel

- [x] Separate digital input states, analogue measurements, and capture/driver
  health using the shared panel roles.
- [x] Retain responsive ADC bars and clearly distinguish active, inactive,
  invalid, stale, and unavailable inputs.
- [x] Move DMA/capture sequence, queue, overflow, cadence, timestamp, and stream
  evidence into engineering diagnostics.
- [x] Verify hydrate and all four existing digital/analogue topics at desktop
  and narrow widths.

Exit criteria: physical I/O state is dense and live, while capture health is
available without competing with the primary inputs.

Completion evidence, 2026-07-13: the Drivers GPIO panel now uses shared Digital
Inputs, Analogue Inputs, and Capture Health roles. T15, start, brake, brake
validity, and both ADC bars retain their push updates; capture overflow,
cadence, queue, and DMA errors are conditions, while sequences, timestamps,
raw counts, and all four stream sources are in Engineering Details. The shared
stage primitive now supports reusable embedded visuals rather than a GPIO-only
layout. Focused live-topic and 390 px tests pass. Board sampling showed digital
state and analogue samples arriving by push, ADC counts and DMA sequence
advancing, and unavailable on-change diagnostic facts rendered grey rather
than as healthy zeroes, with no failed resources or page errors.

Review refinement, 2026-07-14: the two throttle ADC bars now sit directly below
the panel metadata, matching the Throttle and Torque treatment, and a grey
Brake Pressure bar reserves the future analogue input without implying a live
source. The primary Capture Health stage was removed: ADC configuration and
capture-ring occupancy are engineering facts excluded from the compact
30-record physical-input stream, so showing two `n/a` chips was misleading.
Unavailable capture conditions are likewise suppressed; available DMA/capture
faults remain visible and all lower-level fields remain in Engineering details.

## Slice 28.46 Services Fault Manager Panel

- [x] Recast clear/active/latched state, fault class, action/owner, permissions,
  and relevant validity evidence into the shared hierarchy.
- [x] Keep active/latched faults, vetoes, and unsafe or invalid evidence visible
  outside engineering details.
- [x] Move ownership/source, cache/stream, timestamps, and secondary diagnostic
  evidence into the drawer without duplicating the dedicated Faults page.
- [x] Verify clear, active/latched, stale/unavailable, and responsive cases from
  existing facts only.

Exit criteria: the service panel communicates the current fault-manager outcome
and action immediately, with deeper evidence still available elsewhere.

Completion evidence, 2026-07-13: Fault Manager now uses the shared meta, state
rail, Fault State, Response, Permissions, Conditions, and diagnostics grammar.
Faults, vetoed permissions, and invalid source evidence remain visible; action
ownership and stream/source detail are in Engineering Details with a pointer to
the dedicated Faults page. Local tests exercise clear and active/latched states,
permission vetoes, live updates, and 390 px layout. Board inspection confirmed
the clear state, torque veto, live permission source, valid throttle evidence,
and honest grey rendering for unpublished action, clear-gate, and shunt facts,
with no failed resources or page errors.

Review refinement, 2026-07-14: the redundant Clear/Active/Latched state rail was
removed. Fault State remains the single primary presentation of active and
latched state, while clear permission stays in Engineering details.

## Slice 28.47 Drivers Output Drivers Panel

- [x] Merge Intent / Applied Feedback into Output Drivers and remove the
  redundant standalone panel from the Drivers page.
- [x] Show contactor and torque-inhibit intent/applied pairs as explicit command
  flows alongside physical/runtime gate state and safe-open evidence.
- [x] Make feedback mismatch and unavailable physical-application facts honest
  conditions; place request/cache/stream detail in engineering diagnostics.
- [x] Verify live `outputs` updates, mismatch/unavailable rendering, no lost
  fields, page order, and narrow layout.

Exit criteria: one Output Drivers panel owns gate, command, applied-feedback,
and mismatch evidence with no duplicate Drivers surface.

Completion evidence, 2026-07-13: Output Drivers now owns the runtime gate,
safe-open state, physical-application evidence, POS/PRE/NEG/torque-inhibit
command intents, applied feedback, mismatch, and structured-request state. The
standalone Intent / Applied Feedback article has been removed. Focused tests
exercise live `outputs` updates, armed state, intent/applied pairs, unavailable
physical facts, an injected mismatch, page order, and narrow layout. Board
inspection confirmed the four-panel Drivers layout, armed rail, safe-open and
physical evidence, honest unavailable intent/applied facts in the current
bench state, and no page exceptions; the browser recovered from one transient
WebSocket reset immediately after runtime asset sync.

## Slice 28.48 Devices Inverter Panel

- [x] Recast VCU torque intent, monitor-accepted demand, inhibit intent/applied,
  and missing inverter feedback as a clearly labelled partial command path.
- [x] Reuse the signed torque visualization where useful without presenting
  monitor or VCU intent as inverter-reported torque.
- [x] Keep missing ready/enable/actual-torque/fault feedback explicit and defer
  those facts to inverter integration work.
- [x] Verify hydrate, `torque.state`, `torque.sampled`, `outputs`, unavailable
  feedback, and mobile behavior.

Exit criteria: the panel clearly distinguishes what the VCU knows or commands
from inverter facts that do not yet exist.

Completion evidence, 2026-07-13: the Inverter panel now presents the VCU raw
request, Torque Monitor decision and accepted demand, published intent, and
inhibit intent/applied state as a partial command path. The shared signed
torque graph is explicitly labelled Monitor Accepted; inverter ready, enabled,
actual torque, and fault feedback remain grey `not published` conditions.
Focused stream tests cover `torque.state`, `torque.sampled`, and `outputs`, plus
missing feedback and narrow layout. Live board inspection in the safe bench
state confirmed honest unavailable feedback and no page errors; it also caught
and corrected cramped metric-label wrapping at the normal two-panel width.

Review refinement, 2026-07-14: the legacy Diagnostics appendix was removed so
the panel has one disclosure, consistently named Engineering details.

## Slice 28.49 Devices BMS Panel

- [x] Recast source, freshness, discharge/charge permissions, and coverage into
  the shared hierarchy.
- [x] Make compile-time fake versus real-device source unmistakable and retain
  stale/unavailable permission semantics.
- [x] Keep absent pack measurements, limits, and BMS faults explicit without
  inventing placeholders that appear healthy.
- [x] Verify current hydrate/live behavior and narrow layout using the existing
  BMS facts only.

Exit criteria: the partial BMS surface is useful and honest about its source,
permissions-only coverage, and missing integration data.

Completion evidence, 2026-07-13: BMS now uses the shared hierarchy with an
amber synthetic/compile-time-fake source, explicit permissions-only coverage,
and a dedicated permission stage. Pack measurements, power limits, and BMS
faults remain grey `not published` conditions. Local stream tests cover fresh
fake facts, discharge allowed/charge blocked, stale permission suppression,
and narrow layout. Live board inspection confirmed the synthetic source and
fresh permission facts without page errors or layout overflow.

## Slice 28.50 Devices PDM Panel

- [x] Recast selector-source freshness, request/acceptance, CAN source, counters,
  and selector-only coverage into the shared grammar.
- [x] Keep the PDM device/transport perspective distinct from the adopted Drive
  Selector panel's VCU decision perspective.
- [x] Move raw request, sequence/counters, timestamps, and stream/cache evidence
  into engineering diagnostics and state wider PDM gaps explicitly.
- [x] Verify hydrate, live selector changes, stale source, unavailable data, and
  responsive layout.

Exit criteria: the PDM panel adds device/source evidence without duplicating or
contradicting Drive Selector decisions.

Completion evidence, 2026-07-13: PDM now presents the `0x210` receive source,
freshness, requested mode, raw value, VCU receipt state, and receive counters
as a selector-link view. The authoritative VCU decision remains in Drive
Selector; wider PDM channels, loads, and faults are grey `not published`
conditions. Local fixtures cover live accepted input, stale suppression,
unavailable wider facts, and narrow layout. Live board inspection confirmed
the selector facts and lifetime counters; an initial counter-label wrap was
corrected by using the shared one-chip-wide stage treatment.

Review refinement, 2026-07-14: the legacy Diagnostics appendix was removed so
the panel has one disclosure, consistently named Engineering details.

## Slice 28.51 Services Configuration Service Panel

- [x] Adapt cache health, authority, schema/generation, record/storage counts,
  and last error to the shared meta/metric/condition grammar.
- [x] Do not force the non-flow summary into artificial input/state/output
  stages or duplicate the full Configuration workflow page.
- [x] Put lower-level cache/source and endpoint evidence in engineering details
  while preserving `/api/stm32/link` semantics.
- [x] Verify initial hydrate, post-action refresh, error/unavailable state, and
  responsive layout without reintroducing configuration UI lag.

Exit criteria: the compact service summary is consistent with Phase 28 while
remaining distinct from the configuration editing workflow.

Completion evidence, 2026-07-13: Configuration Service now uses shared meta,
metric, condition, and diagnostic primitives without an artificial flow. It
shows STM32 authority, cache/summary health, schema, generation, record counts,
stored bytes, lifetime validation failures, and last error; the full action
workflow remains on Configuration. A reusable `informationMetricsHtml()`
helper removes panel-specific metric markup. Local tests cover valid hydrate,
absent-cache/error state, Services refresh behavior, and narrow layout. Live
board inspection confirmed schema 1.4, generation 22, 39 cached records, no
validation failures, and no page errors.

## Slice 28.52 Services Dashboard Stream Panel

- [x] Adapt browser stream mode, age/freshness, connection state, and aggregate
  delivery health to shared meta/condition presentation.
- [x] Render heap, sent/drop, correlation, and topic counts as dense metrics or
  engineering diagnostics rather than equal state chips.
- [x] Preserve the distinction between browser/WebSocket client state and
  STM32 vehicle/device state.
- [x] Verify reconnect, idle/live/stale, hydrate, update, and narrow-width cases
  without changing subscription behavior.

Exit criteria: stream health is compact and legible without masquerading as a
vehicle input/output panel.

Completion evidence, 2026-07-13: Dashboard Stream now reports browser-client
condition, WebSocket connection, split-topic versus aggregate mode, freshness,
received topics, server sent/drop counters, and free heap without using a
vehicle flow. Correlation, client ID, last message, active subscriptions, and
the browser/STM32 boundary live in Engineering Details. Local tests exercise
idle hydrate, topic update, disconnect/reconnect, server counters, and narrow
layout. Live board inspection showed connected split-topic delivery, fresh
updates, five browser topic messages, server lifetime sent/drop counters, and
no page errors.

Review refinement, 2026-07-14: Last Result is no longer a chatty primary
condition and remains available in Engineering details. Engineering details
uses the shared single-column metric layout for more reliable panel-width and
mobile rendering.

## Slice 28.53 Drivers STM32 / ESP32 UART Panel

- [x] Adapt link state, RX/TX traffic, rejected frames, bytes, and API error to
  link-state/metric/condition/diagnostic groups.
- [x] Preserve `/api/stm32/link` source and cadence, and do not conflate UART
  transport health with structured API or vehicle-state health.
- [x] Keep errors/rejections conspicuous and move secondary counters/source
  evidence into engineering details.
- [x] Verify connected, quiet, error/unavailable, updating, and responsive cases.

Exit criteria: UART transport status can be scanned quickly and retains the
engineering evidence needed to diagnose the STM32/ESP32 link.

Completion evidence, 2026-07-13: STM32 / ESP32 UART now separates UART enable
and handshake state, frame/byte traffic, and structured-API summary/catalogue/
request state. Rejected frames and API error remain conspicuous conditions;
reload and source evidence move to Engineering Details. Local tests cover
active traffic, quiet link, rejected/API-error state, unavailable link, and
narrow layout. Live board inspection confirmed active traffic, `wait` link
state, a not-fresh handshake, valid generation-41 API catalogue, current
lifetime rejected count, and no page errors. Those transport counters are
presented without inferring vehicle health.

## Slice 28.60 Vehicle Page Information Architecture

- [x] Make the Vehicle page a deliberate single-column operational narrative
  rather than allowing its horizontally rich panels to pair unpredictably.
- [x] Order the page as Vehicle FSM, Inhibitions / Readiness, and Powertrain.
- [x] Remove the standalone Freshness panel: retain domain freshness/source in
  each migrated panel and leave HTTP, WebSocket, catalogue, cache, and endpoint
  diagnostics on their owning system/link surfaces.
- [x] Add stable desktop and narrow-width ordering/no-overflow assertions.

Exit criteria: the Vehicle page has one clear top-to-bottom hierarchy, no
standalone transport-diagnostics panel, and no loss of relevant per-domain
freshness evidence.

Completion evidence, 2026-07-14: the Vehicle section now uses the shared
single-column view class and contains only Vehicle FSM, Inhibitions / Readiness,
and Powertrain in that order. The obsolete transport/cache freshness renderer
and DOM surface were removed; each remaining domain panel retains its own
source/freshness contract. The ESP32 web filesystem build passed and the
focused local layout/order regression passed.

## Slice 28.61 Vehicle FSM Panel

- [x] Recast the Vehicle FSM using the shared information grammar and retain
  the genuine Off -> Ignition -> Precharge -> Run -> Shutdown -> Fault ->
  Charge state rail.
- [x] Separate input/request facts, the current FSM decision/state, and its
  high-level HVM/permission outputs without implying ownership of HVM internals.
- [x] Keep transition blockers and faults visible in Conditions; move sequence,
  timestamps, stream source, and raw reasons into Engineering details.
- [x] Verify hydrate/live state transitions, unavailable/fault/inhibited cases,
  and narrow layout without adding STM32 instrumentation.

Exit criteria: the panel answers what whole-vehicle mode is active, what the
FSM is trying to do, and what prevents its next transition while respecting
the documented Vehicle-FSM/HVM boundary.

Completion evidence, 2026-07-14: Vehicle FSM now uses shared metadata, the
genuine vehicle state rail, request/guard, FSM decision, and service-intent
stages, visible blocker/fault conditions, and one Engineering details drawer.
The panel labels HVM state as a coarse service result and explicitly records
that HVM owns HV sequencing. Focused tests cover active and fault/inhibited
permission updates, the active Run rail, the three roles, and narrow stacking.

## Slice 28.62 Vehicle Inhibitions And Readiness Panel

- [x] Recast readiness evidence, decision/blockers, and resulting precharge,
  contactor, motoring, and regen permissions into the shared hierarchy.
- [x] Distinguish source facts such as HVM readiness, BMS discharge permission,
  shunt validity, selector acceptance, and fault state from the permissions
  derived from them.
- [x] Keep the primary active blocker visible and collapse the healthy state to
  a concise `Blockers: none`; retain raw reason/source evidence in Engineering
  details.
- [x] Verify permission-topic updates, initial hydrate, unavailable/stale/fault
  states, and responsive layout without duplicating the Faults or Torque pages.

Exit criteria: the panel explains why the vehicle may or may not proceed and
shows the resulting permissions without presenting every fact as a peer chip.

Completion evidence, 2026-07-14: Inhibitions / Readiness now separates HVM,
BMS, shunt, and selector source facts from the readiness decision and resulting
precharge, contactor, motoring, and regen permissions. Active blockers and
evidence problems remain visible; the clear case reduces to `Blockers: none`.
Focused live permission fixtures cover fault/inhibited and recovered-ready
states, and the shared mobile flow stacks without overflow.

## Slice 28.63 Vehicle Powertrain Synoptic

- [x] Replace the duplicated Torque-Service-plus-DCDC chip wall with a
  full-width two-lane powertrain summary: electrical energy flow and drive
  demand flow.
- [x] Show the energy path as Battery Pack -> Low-Side Bus -> Traction DCDC ->
  High-Side Bus -> Inverter, using only authoritative available measurements
  and explicit unavailable inverter feedback.
- [x] Show the drive path as accepted direction -> fused throttle -> requested/
  accepted torque -> published inverter intent, reusing the responsive signed
  torque graph where it helps rather than duplicating the full Torque Service.
- [x] Implement only small reusable flow-lane/node helpers and generic CSS;
  avoid panel-specific layout markup or new subscriptions outside the existing
  link-subscription model.
- [x] Keep faults, vetoes, stale/invalid evidence visible and move detailed
  DCDC flags, monitor reasons, timestamps, and stream evidence to Engineering
  details or their owning Services/Devices panels.
- [x] Verify initial hydrate, granular live updates, honest partial/unavailable
  states, desktop flow, and vertically stacked mobile behavior.

Exit criteria: Powertrain provides a compact vehicle-level energy-and-demand
story without duplicating the dedicated HVM, Torque Service, Traction DCDC, or
Inverter panels and without inferring missing feedback.

Completion evidence, 2026-07-14: Powertrain is now a full-width two-lane
synoptic built from shared flow-lane and flow-node helpers plus generic CSS.
The energy lane distinguishes shunt Battery Pack and Low-Side Bus evidence,
Traction DCDC low/high-side measurements, and explicitly unavailable inverter
feedback. The demand lane carries accepted direction through fused throttle,
raw and monitor-accepted torque, and VCU-published inverter intent; the shared
signed torque graph remains the primary analogue summary. Dedicated service
detail is not duplicated, and the obsolete one-off Torque/DCDC vehicle
renderers were removed. The ESP32 filesystem build and all 21 local web tests
passed; focused fixtures cover DCDC and torque live updates plus narrow stacked
layout. The image was uploaded to the board and all four applicable board smoke
tests passed. Follow-up board verification advanced both web asset
cache-busters to `v=228-phase28-vehicle-panels`; the served bundle contains the
new FSM, readiness, and Powertrain renderers and no longer contains the
obsolete Vehicle Torque/DCDC chip-wall renderer.

## Slice 28.64 Vehicle Powertrain Energy-Flow Refinement

- [x] Stack metric labels above their values inside Electrical Energy nodes at
  mobile widths while preserving the compact horizontal desktop presentation.
- [x] Add the HVM/precharge stage between Battery Pack and Low-Side Bus using
  existing HVM state, intent, readiness, sequence, and contactor intent/applied
  facts.
- [x] Enrich the Traction DCDC flow node with its published command, high-side
  target, and fault evidence without duplicating the full Devices panel.
- [x] Trace low/high-side DCDC voltage and current through the same sampled
  stream path and capture direct live-topic evidence for their actual cadence.
- [x] Rebuild, upload, and verify desktop/mobile behavior on the board.

Exit criteria: the electrical flow remains compact on desktop, is legible on
mobile, includes the HVM/precharge transition, and does not imply that stable
source values are stale UI values.

Completion evidence, 2026-07-14: Electrical Energy metrics retain their
horizontal desktop rows and stack label above value below 760 px. The flow now
includes HVM / Precharge between Battery Pack and Low-Side Bus with HVM state,
intent, readiness, and POS/PRE/NEG contactor evidence; the Traction DCDC node
adds command result, high-side target, and fault state. A direct 20-message
`traction_dcdc.sampled` capture showed complete payloads every 200 ms: both
voltages were present in every message and remained exactly 218 mV / 375 mV
while currents changed, confirming source stability rather than stale browser
plumbing. The filesystem build and all 21 local web tests passed, the
cache-busted `v=229-phase28-powertrain-energy` image was uploaded, and all four
applicable board smoke tests passed.

## Slice 28.65 Dashboard Vehicle Overview

- [x] Recast Dashboard as an operator overview: concise Vehicle, Readiness,
  HVM, Faults, and Data summary followed by gauges and primary dynamic state.
- [x] Add shared responsive Speed, Motor RPM, and Pack Temperature gauges with
  full scales of 130 mph, 24,000 rpm, and 50 degrees C respectively.
- [x] Keep all three gauges explicitly grey/unavailable until authoritative
  feeds exist, while providing a clearly labelled demonstration sweep between
  approximately 25% and 75% of full scale.
- [x] Lay out Direction, Torque, and Contactors at equal desktop widths; retain
  F/N/R and fold T15, Start, and Brake into Direction as secondary context.
- [x] Remove the low-value Domains panel and the duplicated/low-level Vehicle
  Status card wall; do not move their engineering detail into the overview.
- [x] Stack gauges and dynamic panels cleanly on mobile, preserving honest
  unavailable styling, readable units, and no horizontal overflow.
- [x] Rebuild, upload, and verify hydrate/live dashboard behavior on desktop
  and mobile without adding STM32 instrumentation or proxy telemetry.

Exit criteria: Dashboard answers vehicle mode, readiness, key faults, driver
direction, torque, contactor state, and future primary measurements at a glance
without duplicating the Vehicle, Services, Devices, or system-health pages.

Completion evidence: the Dashboard now presents five compact summary facts,
followed by a responsive three-gauge primary-measurement row and an equal-width
Direction / Torque / Contactors row. Speed, Motor RPM, and Pack Temperature are
truthfully marked unavailable while their grey demonstration needles sweep from
approximately 25% to 75% of 130 mph, 24,000 rpm, and 50 °C full scales. Driver
inputs now sit inside Direction; Domains and the former Vehicle Status card wall
have been removed. The cache-busted `v=230-phase28-dashboard-overview` LittleFS
image built and uploaded successfully. All 22 local web tests passed, and all
five board-applicable tests passed against `http://10.0.1.127`, including the
desktop/mobile dashboard layout, animation, unavailable-state, and overflow
checks.

## Slice 28.70 CAN1 Transmit Backpressure And Completion Hardening

The CAN1 path already has a 16-entry software request ring in front of the
STM32 bxCAN controller's three hardware transmit mailboxes. It currently
removes a request from that ring before establishing mailbox availability and
then performs immediate, no-time-passes retry calls. A temporarily full set of
hardware mailboxes can therefore turn normal backpressure into a permanent
request failure. The published `tx_accepted` value also means only "admitted to
a hardware mailbox", not confirmed on-bus completion.

Bench investigation on 2026-07-14 found identical lifetime totals of 33,225
for low-level CAN1 TX admission failures and selector-response TX failures, but
no new failures across matched T15-off, T15-on, high-side-ready, or
Forward/throttle windows. The powered BDC668 increased receive traffic by
roughly eight times without reproducing the failure. This slice therefore
hardens the structural weakness and corrects the diagnostics without treating
the historical cumulative total as a currently active fault.

- [x] Preserve the oldest queued CAN1 TX request while all three hardware
  mailboxes are occupied; dequeue it only after mailbox admission or explicit
  deadline expiry.
- [x] Replace immediate busy-loop `attempts` with deferred service-pass retry
  semantics, retaining the 1 ms CAN task cadence and bounded per-pass work.
- [x] Keep the shared software queue bounded and deterministic under mixed
  selector-response and three-frame Traction DCDC bursts; document its usable
  capacity and define overflow, fairness, and deadline behaviour.
- [x] Track the owner and correlation of each in-flight hardware mailbox and
  distinguish queue admission, mailbox deferral/admission, deadline expiry,
  successful bus completion, arbitration loss, and transmit error.
- [x] Return owner results to Drive Selector and Traction DCDC only with the
  correct semantics; do not report mailbox admission as confirmed bus
  transmission.
- [x] Publish bounded CAN TX queue depth/high-water, deferred, expired,
  completed, and failed evidence through the existing CAN operator view and
  terminal command, without adding polling outside the structured API.
- [x] Update Drivers -> CAN so current conditions use active/recent failure or
  counter-delta evidence. Keep lifetime totals in Engineering Details and use
  precise labels such as mailbox admission, deadline expiry, and bus TX error.
- [x] Add host coverage for all-mailboxes-busy then recovery, deadline expiry,
  queue overflow, DCDC burst plus selector response, result ownership, and
  transmit-completion/error handling.
- [ ] From a safe reset bench state, verify T15 off, T15 on, high-side ready,
  Forward selection, and throttle exercise with `0x210` requests and `0x220`
  responses visible, no queue/ring overflow, and no false current-fault display
  from historical counters.

Exit criteria: temporary bxCAN mailbox occupancy causes bounded queuing or an
explicit deadline expiry rather than an immediate false failure; selector and
DCDC owners receive truthful completion results; and terminal/web surfaces
separate current CAN health from cumulative history.

Implementation evidence, 2026-07-14: the shared ring remains bounded at 16
storage slots / 15 usable requests and is serviced as a strict FIFO. The head
request remains queued when all three bxCAN mailboxes are occupied; one
deferral is recorded per service pass and later requests cannot bypass it.
Requests leave the FIFO only on mailbox admission or deadline expiry. Admitted
requests retain owner, correlation, context, deadline, and mailbox until bxCAN
reports completion; owners now receive transmitted, expired, arbitration-lost,
or transmit-error results rather than mailbox-admission results. Scheduler
access is serialized across the CAN and application tasks.

The CAN structured view now spans two protocol pages and publishes 39 fields,
including queue depth/high-water/overflow, mailbox deferrals, in-flight count,
confirmed completions, deadline expiry, arbitration loss, and transmit error.
The ESP32 dashboard hydrator fetches and combines both pages. Drivers -> CAN
labels admission and completion separately, derives its current TX condition
from five-second counter-change evidence, and leaves cumulative totals in
Engineering Details.

Verification on the safe T15-off bench completed with the output-enabled BDC668
release build flashed to both controllers. The final `can` sample showed 570
mailbox admissions and 570 confirmed completions, TX queue depth 0/high-water
3, in-flight 0, and zero queue overflow, expiry, arbitration loss, transmit
error, aggregate TX failure, or selector-response failure. `/api/dashboard`
reported the same two-page view with `field_count = 39`; all five applicable
board browser tests passed. The focused scheduler test covers mixed three-frame
DCDC plus selector traffic, busy-mailbox recovery, FIFO ownership/order,
15-entry overflow, queued and in-flight expiry, transmit error, and arbitration
loss. The full host suite passed 36/36 and the local browser suite passed
22/22. The remaining T15-on, high-side-ready, Forward, throttle, and physical
`0x210`/`0x220` exercise stays unchecked for the operator's next powered bench
session.

## Slice 28.71 CAN Transport, Router, And Device Ownership Boundary

The 28.70 investigation confirmed that the low-level CAN1 transport is mostly
device-agnostic, but the current `can1_vehicle_dispatch_service` combines
subscription routing with Shunt and Drive Selector protocol ownership. The CAN
operator view also mixes global bus health, generic delivery evidence, and
device-specific decoded/response counters. This conflicts with the durable CAN
bus device safety contract and will become increasingly costly as inverter,
BMS, charger, and further PDM integrations arrive.

- [x] Keep the CAN1 hardware transport limited to controller setup, filters,
  ISR/raw RX buffering, generic TX queue/mailbox/deadline handling, and global
  bus-pressure/error diagnostics.
- [x] Replace device-named TX scheduler ownership with an opaque result endpoint
  token plus correlation/context; keep all endpoint interpretation outside the
  scheduler and hardware transport.
- [x] Recast CAN1 dispatch as a generic static subscription router which only
  matches descriptors, invokes bounded owner delivery endpoints, and records
  generic matched/delivered/rejected/unhandled evidence.
- [x] Move Shunt subscription declarations, decode state, validation, packet
  counters, measurement publication, and snapshot access into a Shunt-owned CAN
  service.
- [x] Move Drive Selector subscription declaration, decode/state, response-frame
  construction, TX-result interpretation, stale handling, packet counters, and
  event/record publication into a Drive Selector-owned CAN service.
- [x] Keep Traction DCDC frame decode and command-result interpretation in its
  existing device service; expose its subscription descriptors through the
  same device-owned composition contract used by the other CAN devices.
- [x] Compose the reviewed static CAN1 subscription registry at the application
  boundary without adding device branches or decoders to the transport/router.
- [x] Separate global CAN transport/router diagnostics from per-device packet
  and protocol diagnostics in the structured API and Drivers -> CAN surface;
  retain device counters in their owning terminal/web views where currently
  published.
- [x] Add host coverage proving generic routing, opaque TX-result ownership,
  Shunt decode/publication, Drive Selector request/response/stale behavior, and
  unchanged Traction DCDC delivery under the new ownership boundary.
- [ ] Re-run host, STM32/ESP32, local browser, and safe-bench CAN verification;
  leave powered T15/high-side/Forward/throttle evidence with the remaining
  28.70 operator bench step.

Exit criteria: neither the CAN hardware transport nor generic router names or
decodes a vehicle device; subscription and protocol facts are owned by device
services; TX results return through opaque endpoints; and CAN versus device
diagnostics remain truthful without regressing current bench behavior.

Implementation evidence, 2026-07-14: CAN RX subscriptions now contain an
opaque `CanDeliveryEndpoint`, and TX requests/results contain an opaque
`Can1TxResultEndpoint`. The generic dispatch service only matches the composed
registry, calls the selected endpoint, and counts generic dispatch, match,
delivery, rejection, ignored, and unhandled outcomes. It contains no vehicle
IDs, device headers, decoders, response construction, or stale logic.

Drive Selector and Shunt now have explicit CAN service modules which export
their own subscription descriptors and own decode state, event publication,
protocol counters, selector response construction/completion, and selector
stale handling. The existing Traction DCDC service exports its four BDC668
descriptors and owns its opaque TX completion endpoint. `main.cpp` is the
composition root which concatenates the reviewed 13 descriptors and maps the
three endpoint tokens to their services.

The CAN operator view is again a single 30-field page containing only bus,
ring, generic-router, and generic-TX scheduler evidence. Shunt counters remain
in the Shunt view; selector response completion counters moved to the Drive
Selector group in the paged Inputs view; Traction DCDC counters remain in its
device view. Drivers -> CAN now presents only generic routing and transport
health. The ESP32 snapshot hydrator checks the protocol `has more` flag, so it
works with both single- and multi-page views.

Host coverage now includes generic endpoint routing, opaque scheduler result
return, selector-owned request/response/result behavior, Shunt-owned
decode/publication/rejection behavior, device-owned descriptor declarations,
and the existing Traction DCDC service tests. The host suite, STM32 release
build, ESP32 firmware/web builds, and 22-test local browser suite pass. Safe
bench flashing and live CAN verification remain open with the final checklist
item and the powered portion of Slice 28.70.

## Slice 28.90 Review, Bug Ledger, And Close-Out

- [x] Review the prototypes with the operator and record adopt, revise, or
  reject decisions for each shared pattern.
- [x] Classify discovered issues as Phase 28 fixes, later page migrations,
  missing-data work, or unrelated bugs.
- [x] If adopted, record a bounded follow-up migration list rather than silently
  expanding Phase 28 across every page.
- [x] Update the Phase 28 brief, top-level status, evidence, and close-out notes.
- [x] Run final relevant tests and builds and commit the completed phase.

Exit criteria:

- The project has a reviewed panel grammar, three proven prototypes, the 13
  agreed migrations completed or explicitly deferred, and a clear bug ledger
  without leaving Phase 28 indefinitely open.

Prototype adoption and follow-up ledger:

- Adopted: the shared input -> decision/state -> output hierarchy, visible
  condition strip, dense numeric metrics, categorical state rails/chips,
  text-backed colour key, and persistent engineering-details drawer.
- Adopted prototypes: Services -> Torque Service, Devices -> Drive Selector,
  and Devices -> Traction DCDC. Operator review confirmed the direction and
  accepted all three after the recorded refinements and live torque check.
- Fixed in the prototype path: disclosure state/click races, DCDC measurement
  colour and rail consistency, narrow-stage chip overflow, duplicate Torque
  Service presentation, signed torque plumbing and units, torque state/sample
  stream separation, automatic browser torque subscription, and redundant
  Vehicle-page panels.
- Agreed bounded migrations are recorded in Slices 28.41-28.53 and the later
  Vehicle-page follow-on in Slices 28.60-28.63. Charging and
  Chargers are deferred until real feeds exist; Intent / Applied Feedback will
  be consolidated into Output Drivers. Other browser pages are not part of
  this migration run.
- Missing-data work remains separate from presentation migration. Inverter,
  charger, broader BMS/PDM facts, and other not-yet-published device data must
  be added by their owning integration work rather than invented by Phase 28.
- Phase 28 closed on 2026-07-14 after operator review of the migrated surfaces,
  live motoring/shutdown presentation, CAN ownership cleanup, and final build
  and test evidence. Further presentation nuances are normal follow-up work,
  not a reason to keep the phase active.

Close-out evidence, 2026-07-14: the host suite passed 38 tests; STM32 release,
ESP32 firmware, and ESP32 web filesystem builds passed; the 22-test local
browser suite and focused Powertrain regression passed; and the live board
served the final bundle with separate PRE, NEG, and POS HVM/Precharge rows.
The operator confirmed the completed surface was working well through the
available bench states. The remaining powered CAN selector edge cases recorded
in Slices 28.70/28.71 and Phase 27 remain narrow follow-up evidence and do not
keep Phase 28 open.

Post-close maintenance evidence, 2026-07-15: sustained compact-stream and
headless-browser probes confirmed live throttle, torque, shunt, and Traction
DCDC updates after the ESP32 recovery fix; the ESP32 release build and flash
passed. The STM32 output-capable BDC668 release build and all 38 host tests
passed after adding output-state change detection, the image flashed and
reconnected cleanly, and the safe-open `output_gate_state` baseline was current.

## Verification

Minimum expected evidence:

- local web test suite;
- ESP32 build when bundled/deployed assets or firmware integration are touched;
- live-board web probe and browser inspection after asset sync or flash;
- desktop and narrow-width review of every panel touched by the active slice;
- hydrate and WebSocket update checks;
- representative healthy, inactive, unavailable/stale, inhibited, and fault
  rendering where the current bench can safely produce them;
- no obvious new WebSocket, link, heap, or CPU pressure regression.

## Stop Rules

- Stop if presentation code begins deciding vehicle state, permission, fault,
  validity, or freshness instead of rendering authoritative facts.
- Stop if numeric or diagnostic detail is removed without remaining reachable
  in the panel or its diagnostics drawer.
- Stop if colour becomes the only state discriminator.
- Stop if the prototype requires speculative STM32 facts or new instrumentation.
- Stop and record a deferred bug if a fix would materially expand into control
  firmware, protocol redesign, or unrelated page work.
- Stop any migration not named in Slices 28.41-28.53 or 28.60-28.63 until it is separately
  reviewed and added to the plan.

## Completion Criteria

Phase 28 is complete when:

- a reusable input -> decision/state -> output panel grammar exists;
- Torque / Drive Permissions, Drive Selector, and Traction DCDC use it;
- all 13 agreed Services, Devices, and Drivers migrations are completed or
  explicitly deferred with their reason recorded;
- the Vehicle page is single-column and its FSM, readiness, and powertrain
  surfaces complete Slices 28.60-28.63;
- categorical chips, dense numeric metrics, conditions, freshness/validity,
  and diagnostics have consistent roles;
- all migrated panels retain correct hydration and live updates;
- local and live-board browser evidence passes at desktop and narrow widths;
- defects and further migration candidates are recorded and classified; and
- the operator has reviewed the completed migration set and the phase is
  closed or revised explicitly.

## Investigation Notes

- 2026-07-13: Phase created after Phase 27 close-out. Initial direction agreed:
  consistent panel header; three-column input/state/output flow; always-visible
  condition strip; expandable diagnostics; chips for categorical facts;
  aligned rows for numeric facts; and stable, text-backed colour semantics.
- 2026-07-13: Slice 28.00 audit found no STM32 instrumentation gap. All three
  panels hydrate from `/api/dashboard` and update from existing typed caches and
  granular topics: `permissions`/`torque`, `digital_inputs.state`, and
  `traction_dcdc.state` plus `traction_dcdc.sampled`. Drive Selector and
  Traction DCDC were flattening primary state, measurements, conditions,
  counters, and timestamps into equal chips. Torque / Drive Permissions was
  rendering only the permission matrix although cached torque service/monitor/
  intent facts were already available.
- 2026-07-13: Added reusable `informationPanelHtml`, stage, and metric helpers.
  The responsive contract is three equal stages above 760 px and one stacked
  column at or below 760 px. Requested/input facts use purple, internal active
  state uses cyan, accepted/healthy output uses green, inhibited/degraded uses
  amber, fault uses red, and unavailable remains grey; every state retains a
  text label.
- 2026-07-13: Prototype conversion complete for the three selected panels.
  Engineering details now hold selector counters/timestamps, DCDC TX/update/
  feed evidence, and torque reasons/inhibit evidence. Conditions remain visible
  outside the drawer. One presentation regression found by tests was fixed:
  permission values retain authoritative `yes`/`no` rather than changing to
  `allowed`/`blocked`, and absent runtime-regen detail is `unavailable` rather
  than `No feed` while only the permission topic is present.
- 2026-07-13: Generated assets rebuilt; local Playwright suite passed 9/9,
  including a 390 px stacked-flow/no-overflow regression for all prototypes;
  `make esp32-build` passed at 55.7% RAM and 86.6% application flash; web sync
  uploaded only `app.bundle.js` and `styles.css`; board browser suite passed all
  4 applicable tests with 4 fixture-only tests skipped; and
  `esp32_web_probe.mjs --ws-dashboard` confirmed live HTTP/WebSocket status and
  the existing cached permission, selector/throttle, and DCDC facts. In-app
  visual inspection could not be captured because the browser-control runtime
  failed to start, so before/after screenshots and manual desktop/narrow panel
  review remain open.
- 2026-07-13: Operator review accepted the direction and found that engineering
  disclosure controls appeared inert. Root cause was the live render loop
  replacing each panel's DOM and therefore resetting native `<details>` state
  to closed. Shared panel replacement now preserves open disclosures across
  refreshes; a regression opens DCDC engineering details, applies a sampled
  stream update, and confirms the drawer remains open. The richer panel grammar
  also established a practical two-panel-wide limit: general `.view` pages now
  use two desktop columns and retain the existing one-column mobile layout.
  Services now has one consolidated `Torque Service` panel using the richer
  former Torque / Drive Permissions content; the redundant older Torque
  Service card was removed. Revised assets were synced to the board and all 4
  applicable board tests passed, with 5 fixture-only tests skipped.
- 2026-07-13: Follow-up operator review found opening a disclosure could still
  require several clicks. A deliberately slow pointer regression reproduced
  the remaining race: live rendering could replace the summary between pointer
  down and native click activation. Disclosure state is now explicit browser
  presentation state, toggled on pointer-down (or keyboard click), while the
  interacted panel is briefly held stable. The slow-click test holds the mouse
  down across several render periods, confirms the drawer opens on the first
  interaction, applies a stream update, and confirms it stays open. Local suite
  passed 9/9; revised cache-busted assets were synced and all 4 applicable board
  tests passed with 5 fixture-only tests skipped.
- 2026-07-13: Added a persistent, text-backed colour key below every page
  heading for requested, live, healthy, inhibited, fault, and unavailable
  states. Review also identified that Traction DCDC low/high-side measurements
  were incorrectly using the purple requested-input treatment. The measurement
  stage and its voltage/current values now use the cyan live-data treatment;
  the purple treatment remains reserved for requested or commanded intent.
- 2026-07-13: DCDC panel review standardized the state rail: every inactive
  state now uses the same subdued grey treatment and one-pixel chip border,
  ordinary active states use green, and active Blocked/Fault states retain
  amber/red safety meaning. Blocked and Fault remain on the rail because they
  are state-machine outcomes, distinct from the independent condition flags.
  Chips inside information-flow stages now form a one-column stack so long
  enumerated values cannot compete for half of a narrow sub-panel.
- 2026-07-13: Torque review found the Dashboard torque indicator still read
  retired `torque_request_nm`/`torque_applied_nm` fields and therefore did not
  move with the current compact torque stream. Added one shared responsive
  signed-torque graph for Dashboard and Torque Service, now driven by diagnostic
  published intent in deci-Nm. Its negative/positive halves scale from the
  active cached regen and motoring configuration limits, with safe project
  defaults while configuration is still loading. Raw request and monitor-
  accepted values remain visible alongside published output so an inhibited
  zero is distinguishable from missing accelerator demand. Browser regression
  work also exposed and fixed a tenfold unit error: formatted Nm was being
  reparsed as raw deci-Nm because compact-stream raw values were not preserved
  through the shared status merge. Torque reason enums now retain their text
  labels through the same path.
- 2026-07-13: Live forward bench evidence confirmed Torque Service and Torque
  Monitor produced and accepted a nonzero request while the deliberately
  deferred diagnostic published intent remained unavailable/zero. The shared
  signed graph now visualizes the monitor-accepted request on Dashboard and
  Services, using an explicit red `Monitor Accepted` label and red bar so it
  cannot be mistaken for a published inverter command. Published intent stays
  separately visible in the output stage.

Leave a Comment