
This post is going to be:
- Super Nerdy
- Only for people who REALLY like my deep dives
- And even then only if you need to debug the particular Verhicle Control Unit I’m using in my Project sEVen conversion (ZombieVerter VCU)
I’ll probably do a video about all of this soon, because there’s way more to see than I can realistically add as images to this post. The link to the video will appear here if I get around to it.
But if you’re in the market for this kind of info then you’ll also be looking for scripts and config files that are less easy to use from a video, so I’ll include those below too.
And the story goes like this:
What Started All of This
So I decided my Project sEVen EV conversion needed a Vehicle Control Unit (VCU). I’d originally thought I’d be able to just use an AIM Technologies PDM32 to control the car. They’re pretty programmable and have screens, IMU, soft-fused power switching, etc etc. Then I realised I was going to need much more in the way of control than the simple graphical logic builder could deliver in the PDM32. There are people who will tell you differently, but I suspect they’re not software people!
I toyed around for a while thinking I might do a VCU with a Pi or an Arduino but they’re not really automotive grade and there’d be a lot of code needed.
The ZombieVerter had come across my radar before, but at the time (3 years ago) it had promise but I couldn’t see how I could use what they’d got at the time (though that’s almost certainly my lack of vision that made me decide that).
But I now needed a VCU and the ZombieVerter is based on an automotive grade STM32 processor and with a software framework that I could adapt to what I needed.
So I bought a ZombieVerter with all the cases and enclosures and put it aside while I concentrated on gearboxes.
But over the last month or so (Jan 2026) the gearbox for my project had sort of stalled at the production stage and I could start looking at the electronics of the car.
After connecting up the VCU, various CANBuses, contactors and the AIM PDM it was mostly working. I could get all of the above to mostly talk to each other and to engage the contactors.
Here’s a quick video of where the project has got to with a test-bench I’m working on at the moment…
But… the ZombieVerter VCU comes with (at least I bought the option with one) a Wemos D1 Mini ESP8266 web interface board. The ESP8266 shows a web interface to control the VCU and talks to the VCU’s STM32 over a serial port. All well and good so far.
However, mine was proving to be unreliable. The ESP8266 is a gateway which sends commands to, and gets responses from, the main ZombieVerter processor, which is an STM32. It relays the messages through an onboard webserver, hosted on the ESP8266, to a remote browser.
One of the main command/response activities between the browser client and the STM32 is a request and response for a JSON object. This object contains all the parameters (which inverter you’re using, what vehicle its on etc) that can be set on the VCU along with all the spot values that the VCU is working with – voltages, currents, vehicle state etc etc.
But for some reason my setup was showing communications errors when trying to do this JSON grab. And this would manifest as a red banner at the top of the web interface and nothing showing for parameters or spot values.
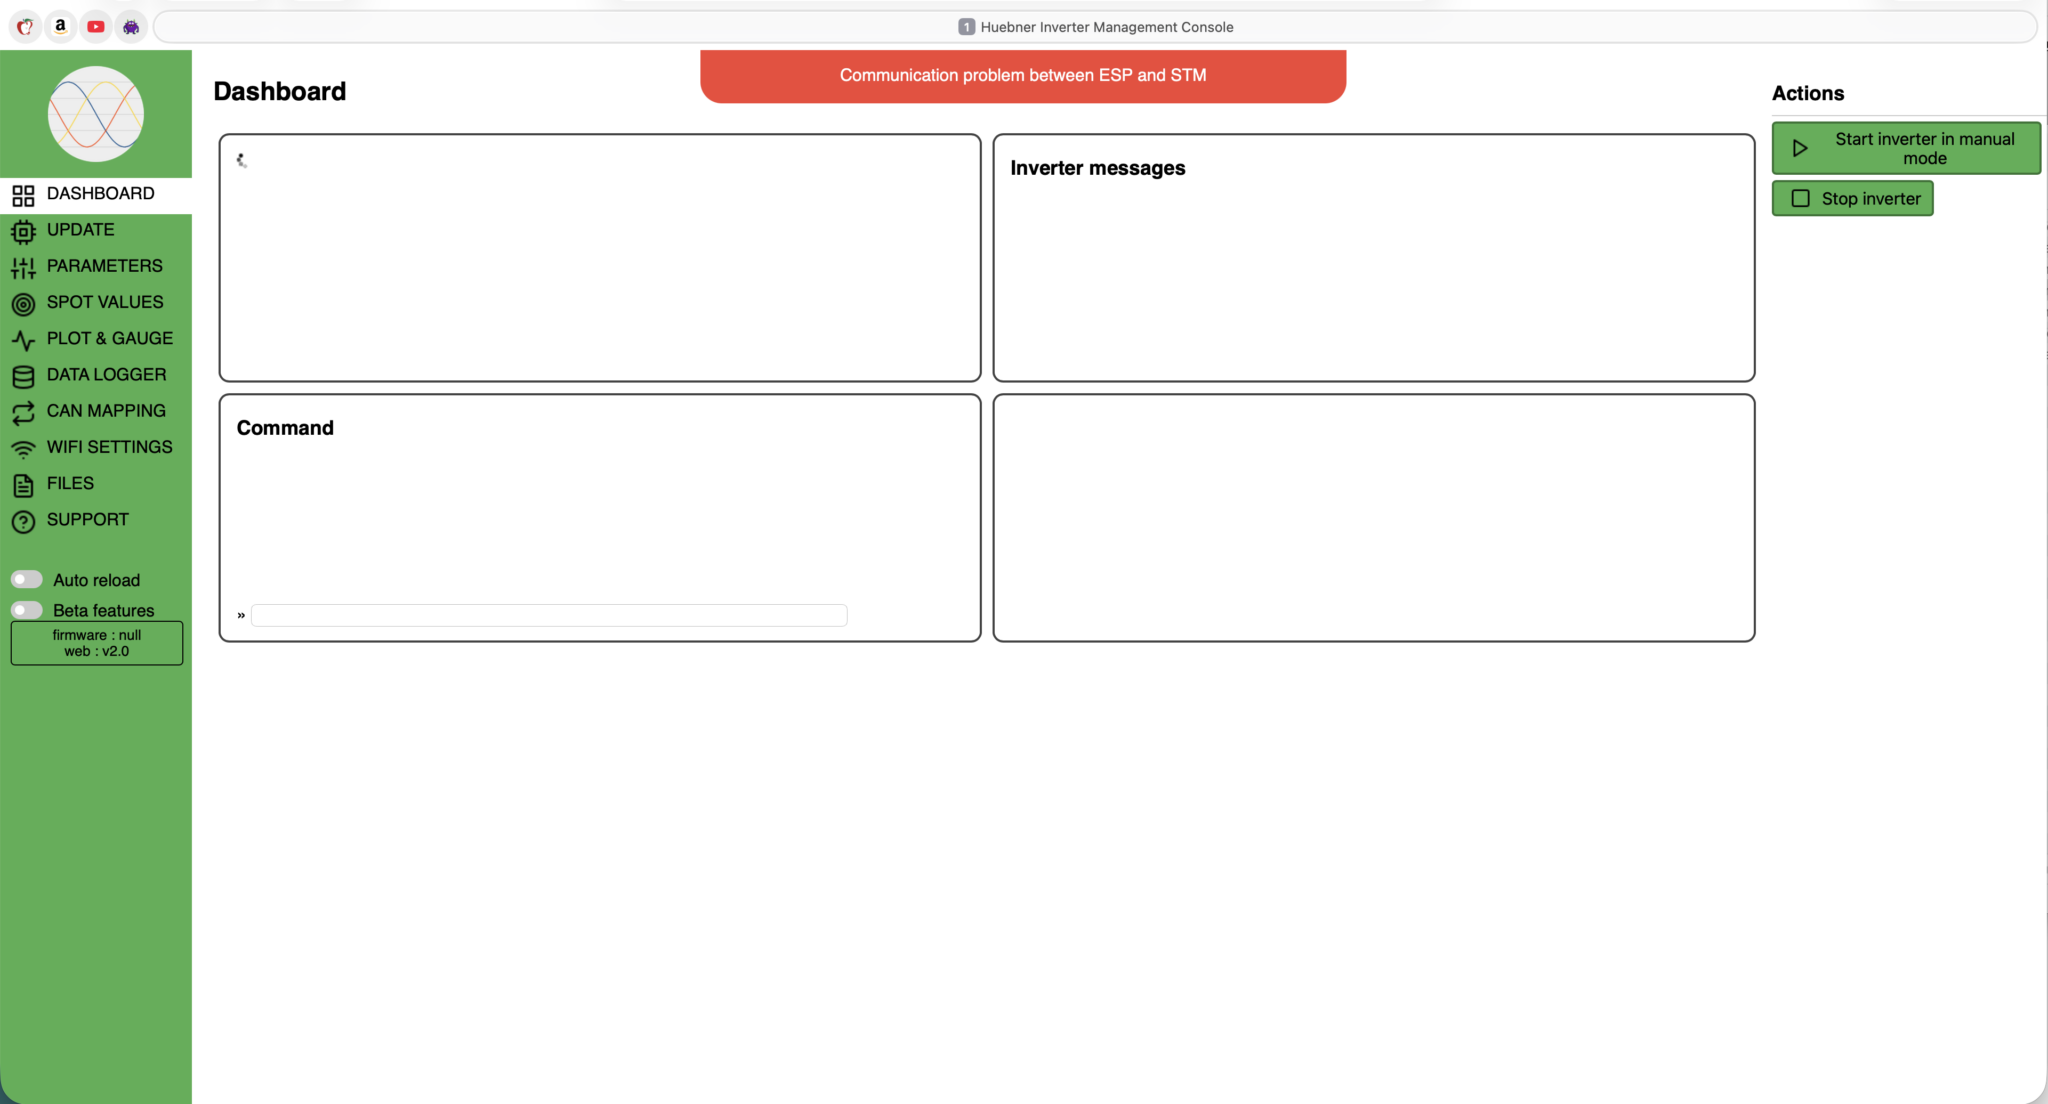
I could work around this issue while I was bringing things up, but it got more and more annoying as I was trying to rely on the web interface to tell me what was going on.
And then it got too much and I decided to try and fix it.
Fixing the Webserver App
I suspected a few things that might be going on. We’ll cover them in more detail later, or at least once I’ve spent a few more hours doing some further testing. The theories about what might be going on were:
- Signal integrity on the STM32 to ESP8266 UART connection
- Hardware FIFO overflow on the ESP8266 receive path
- Software FIFO overflow on the ESP8266
- Heap fragmentation on the ESP8266
- Wifi drop-outs and retransmissions (this could probably be the cause of points 2, 3 and 4 above)
So…. after a few days floundering around learning the code and venturing down some rabbit holes, I’ve now got a debug environment set up for the STM32 and ESP8266 (Visual Studio Code and PlatformIO). And I’ve now got a stable webserver, serving up JSON parameters, spot values etc to my web browser.
But I thought a post here would be useful to show what I’ve done to get a debug environment up and running and so I can come back to what I’ve done here in the future, or else I’ll forget. And I’ll also cover what I did to fix the issue – though I must stress this is just my approach to the problem, I’m sure there must be better and probably simpler ways of doing the same.
It must be said though… this process of debugging two different processor families, talking to each other, is not a trivial project. I’ve been using Visual Studio Code for this sort of stuff for 7 or 8 years, debugging all sorts of projects, including remote real-time applications. And it still took me many hours to get all this hooked up. But it can be done, and here’s how I did it…
The Setup
For the moment, I’m just trying to figure out the Red Banner problem. This setup may (and probably will) get used for all sorts of other future bits of the project but for the moment it’s just the Red Banner.
So lets go through each of the components, how they’re set up and how I use them.
ZombieVerter Connections
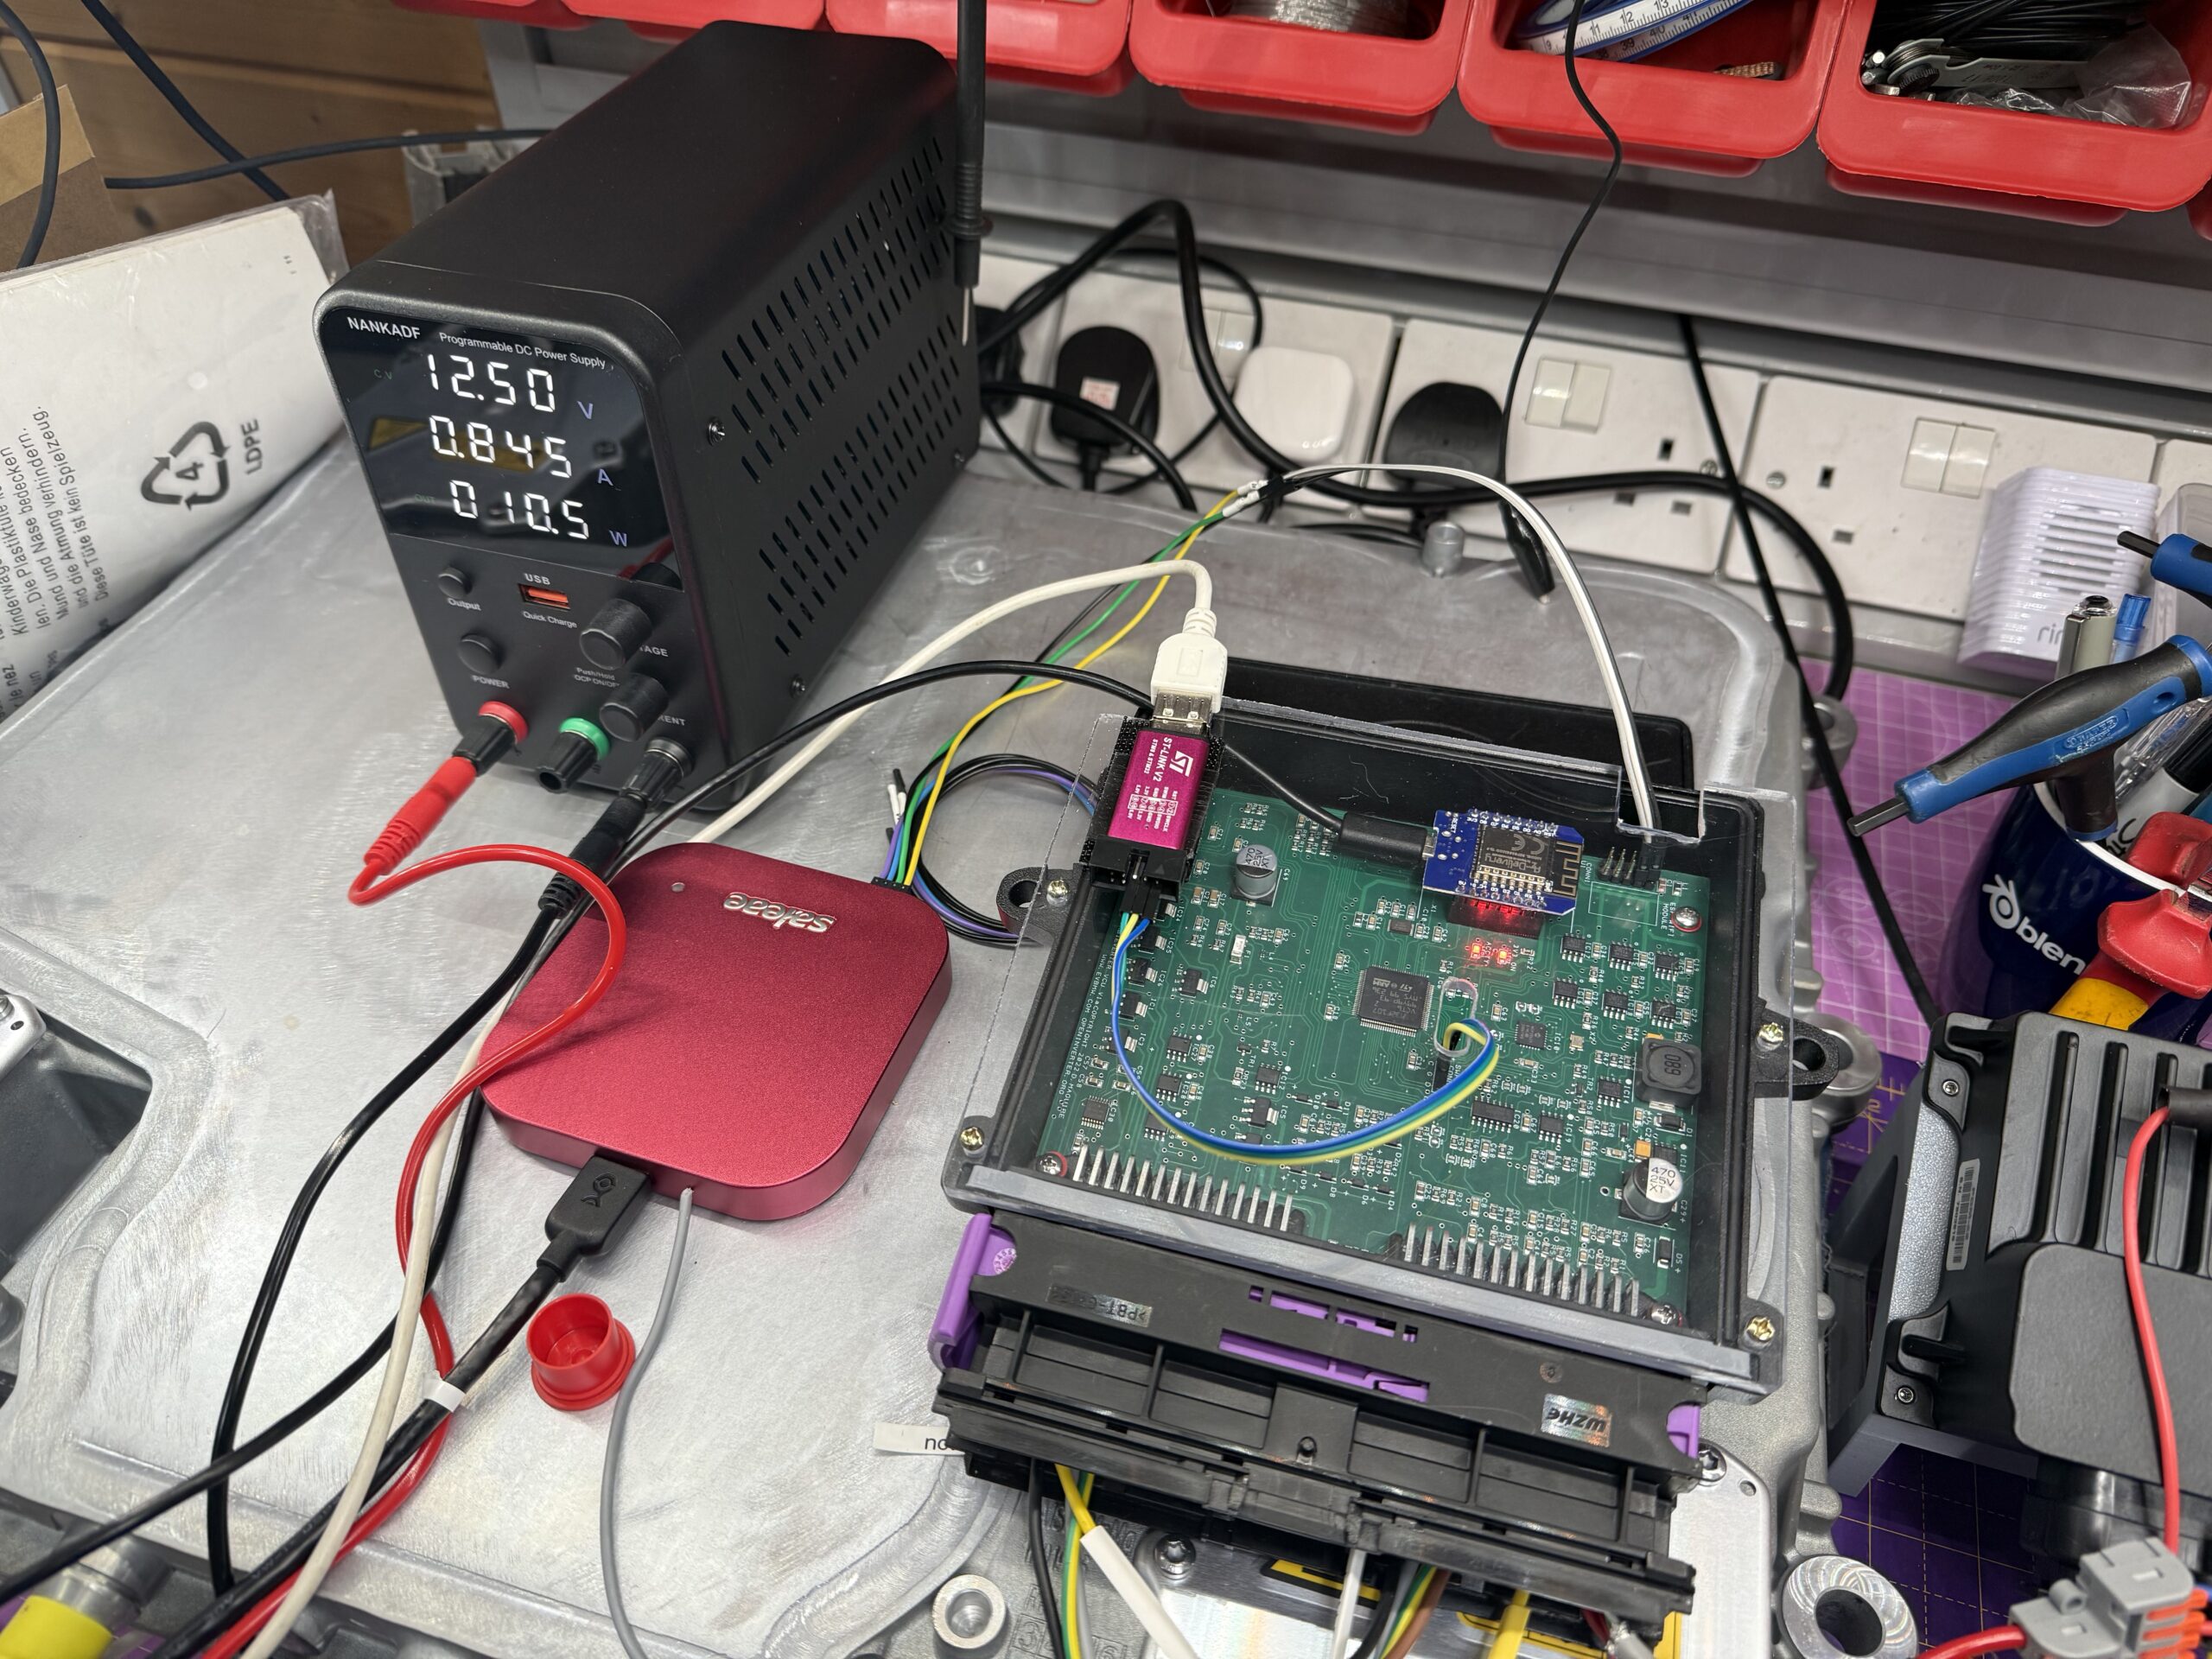
Here’s how I’ve got the ZombieVerter hooked up in my test rig at the moment…
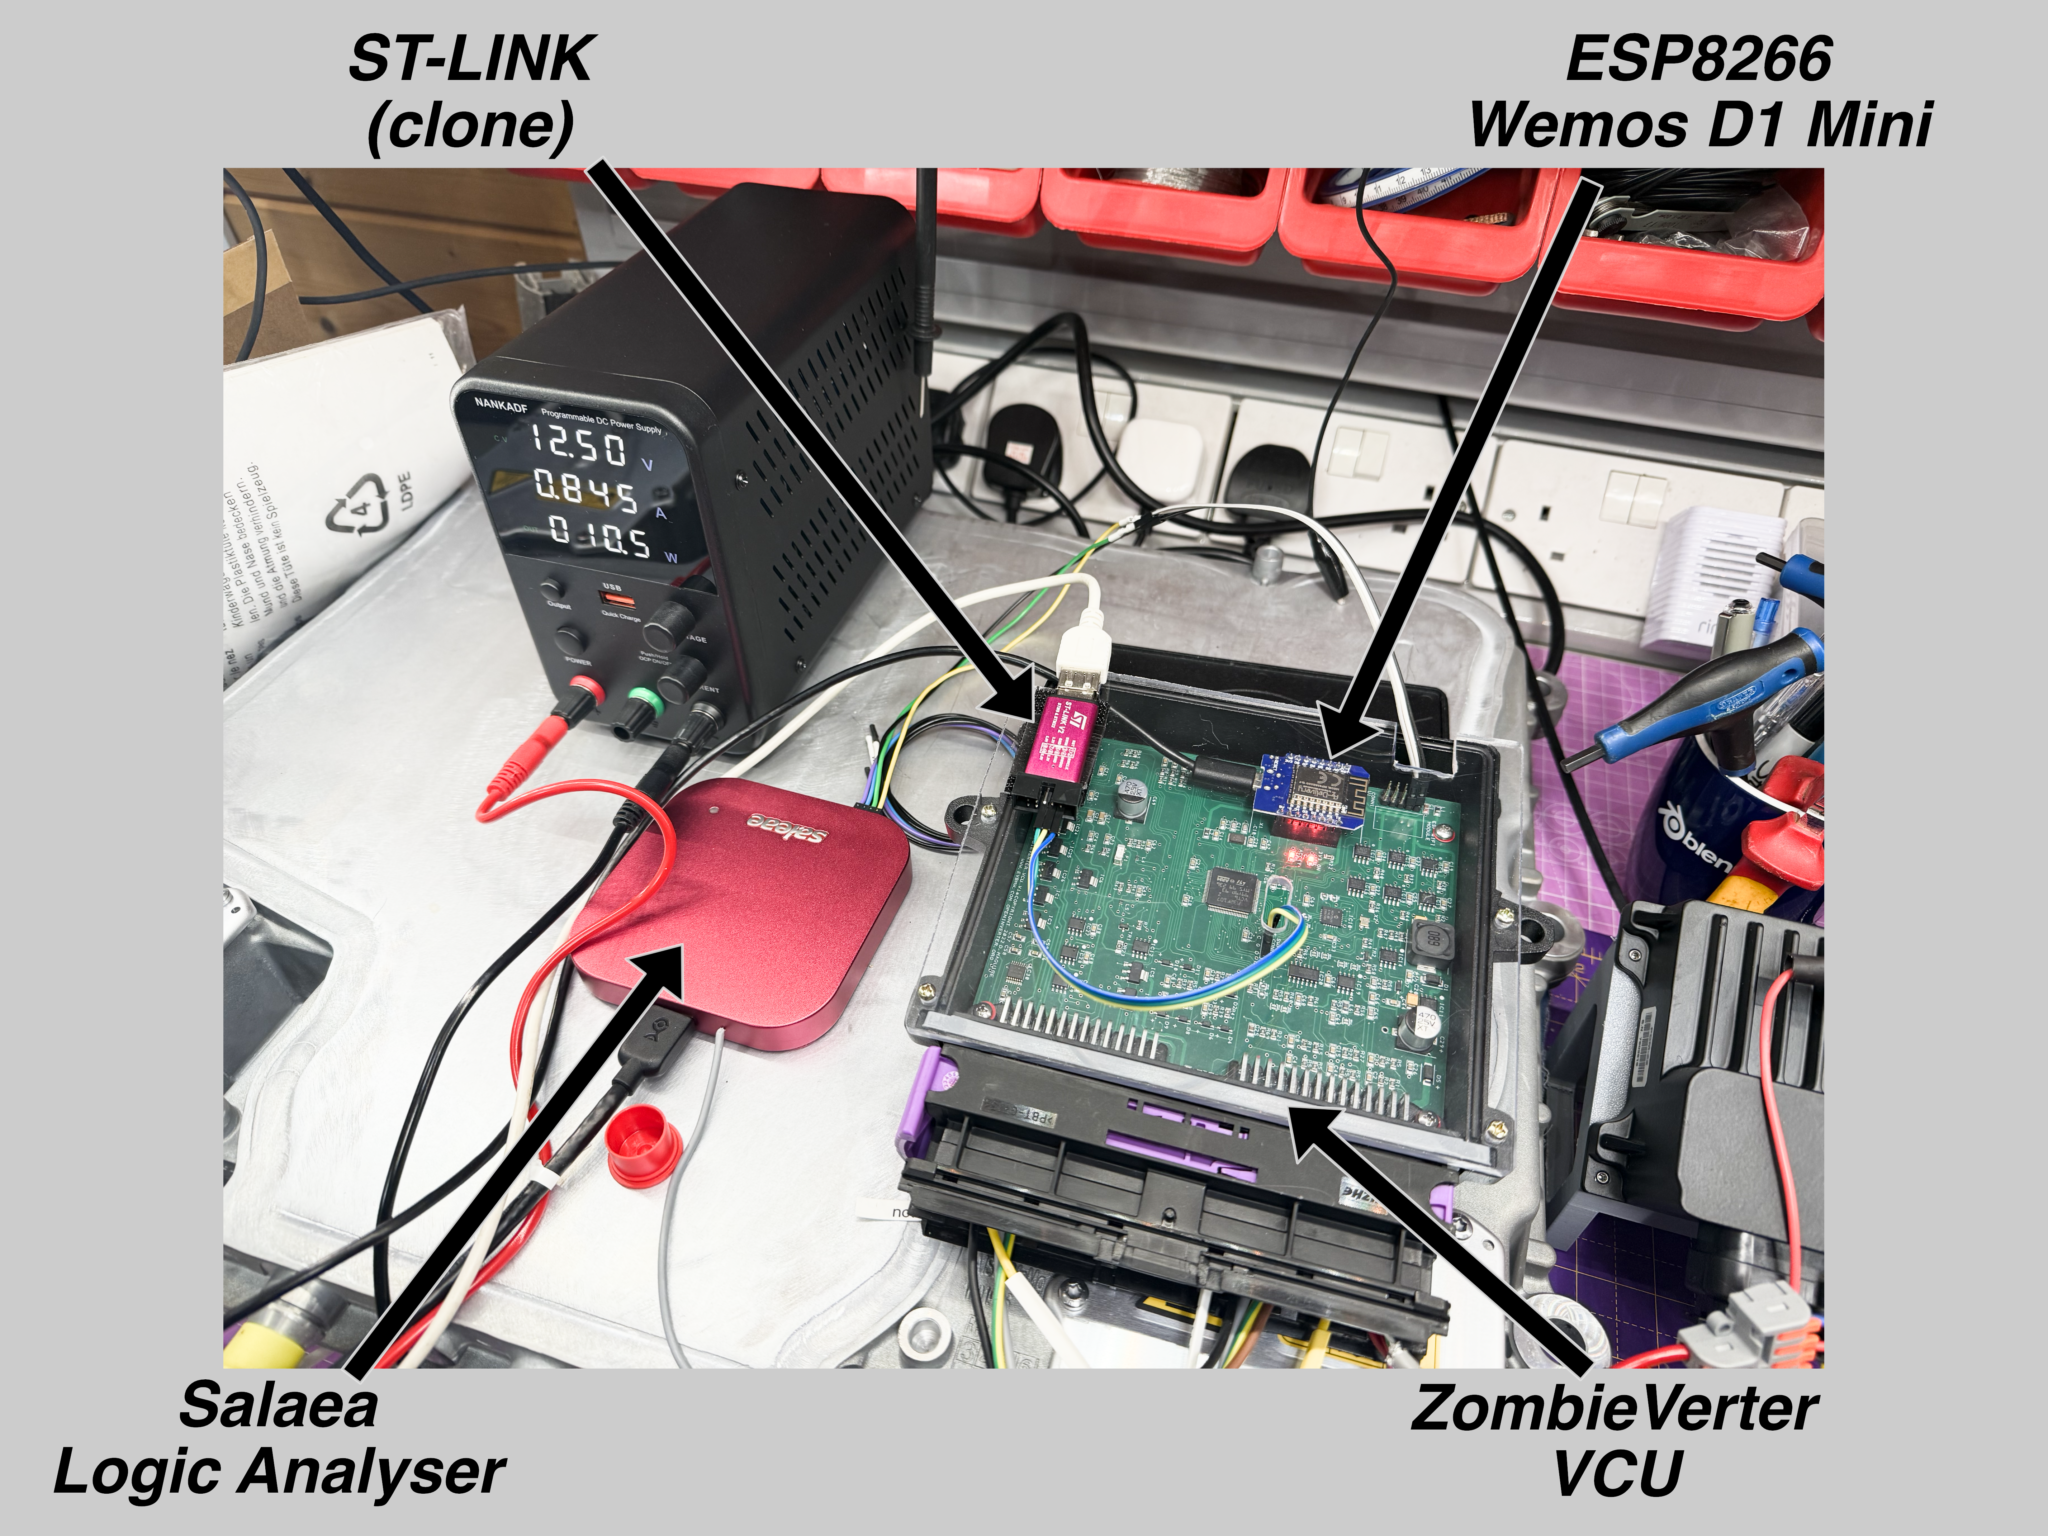
And here’s the signal connections to the ST-LINK programmer/debugger.
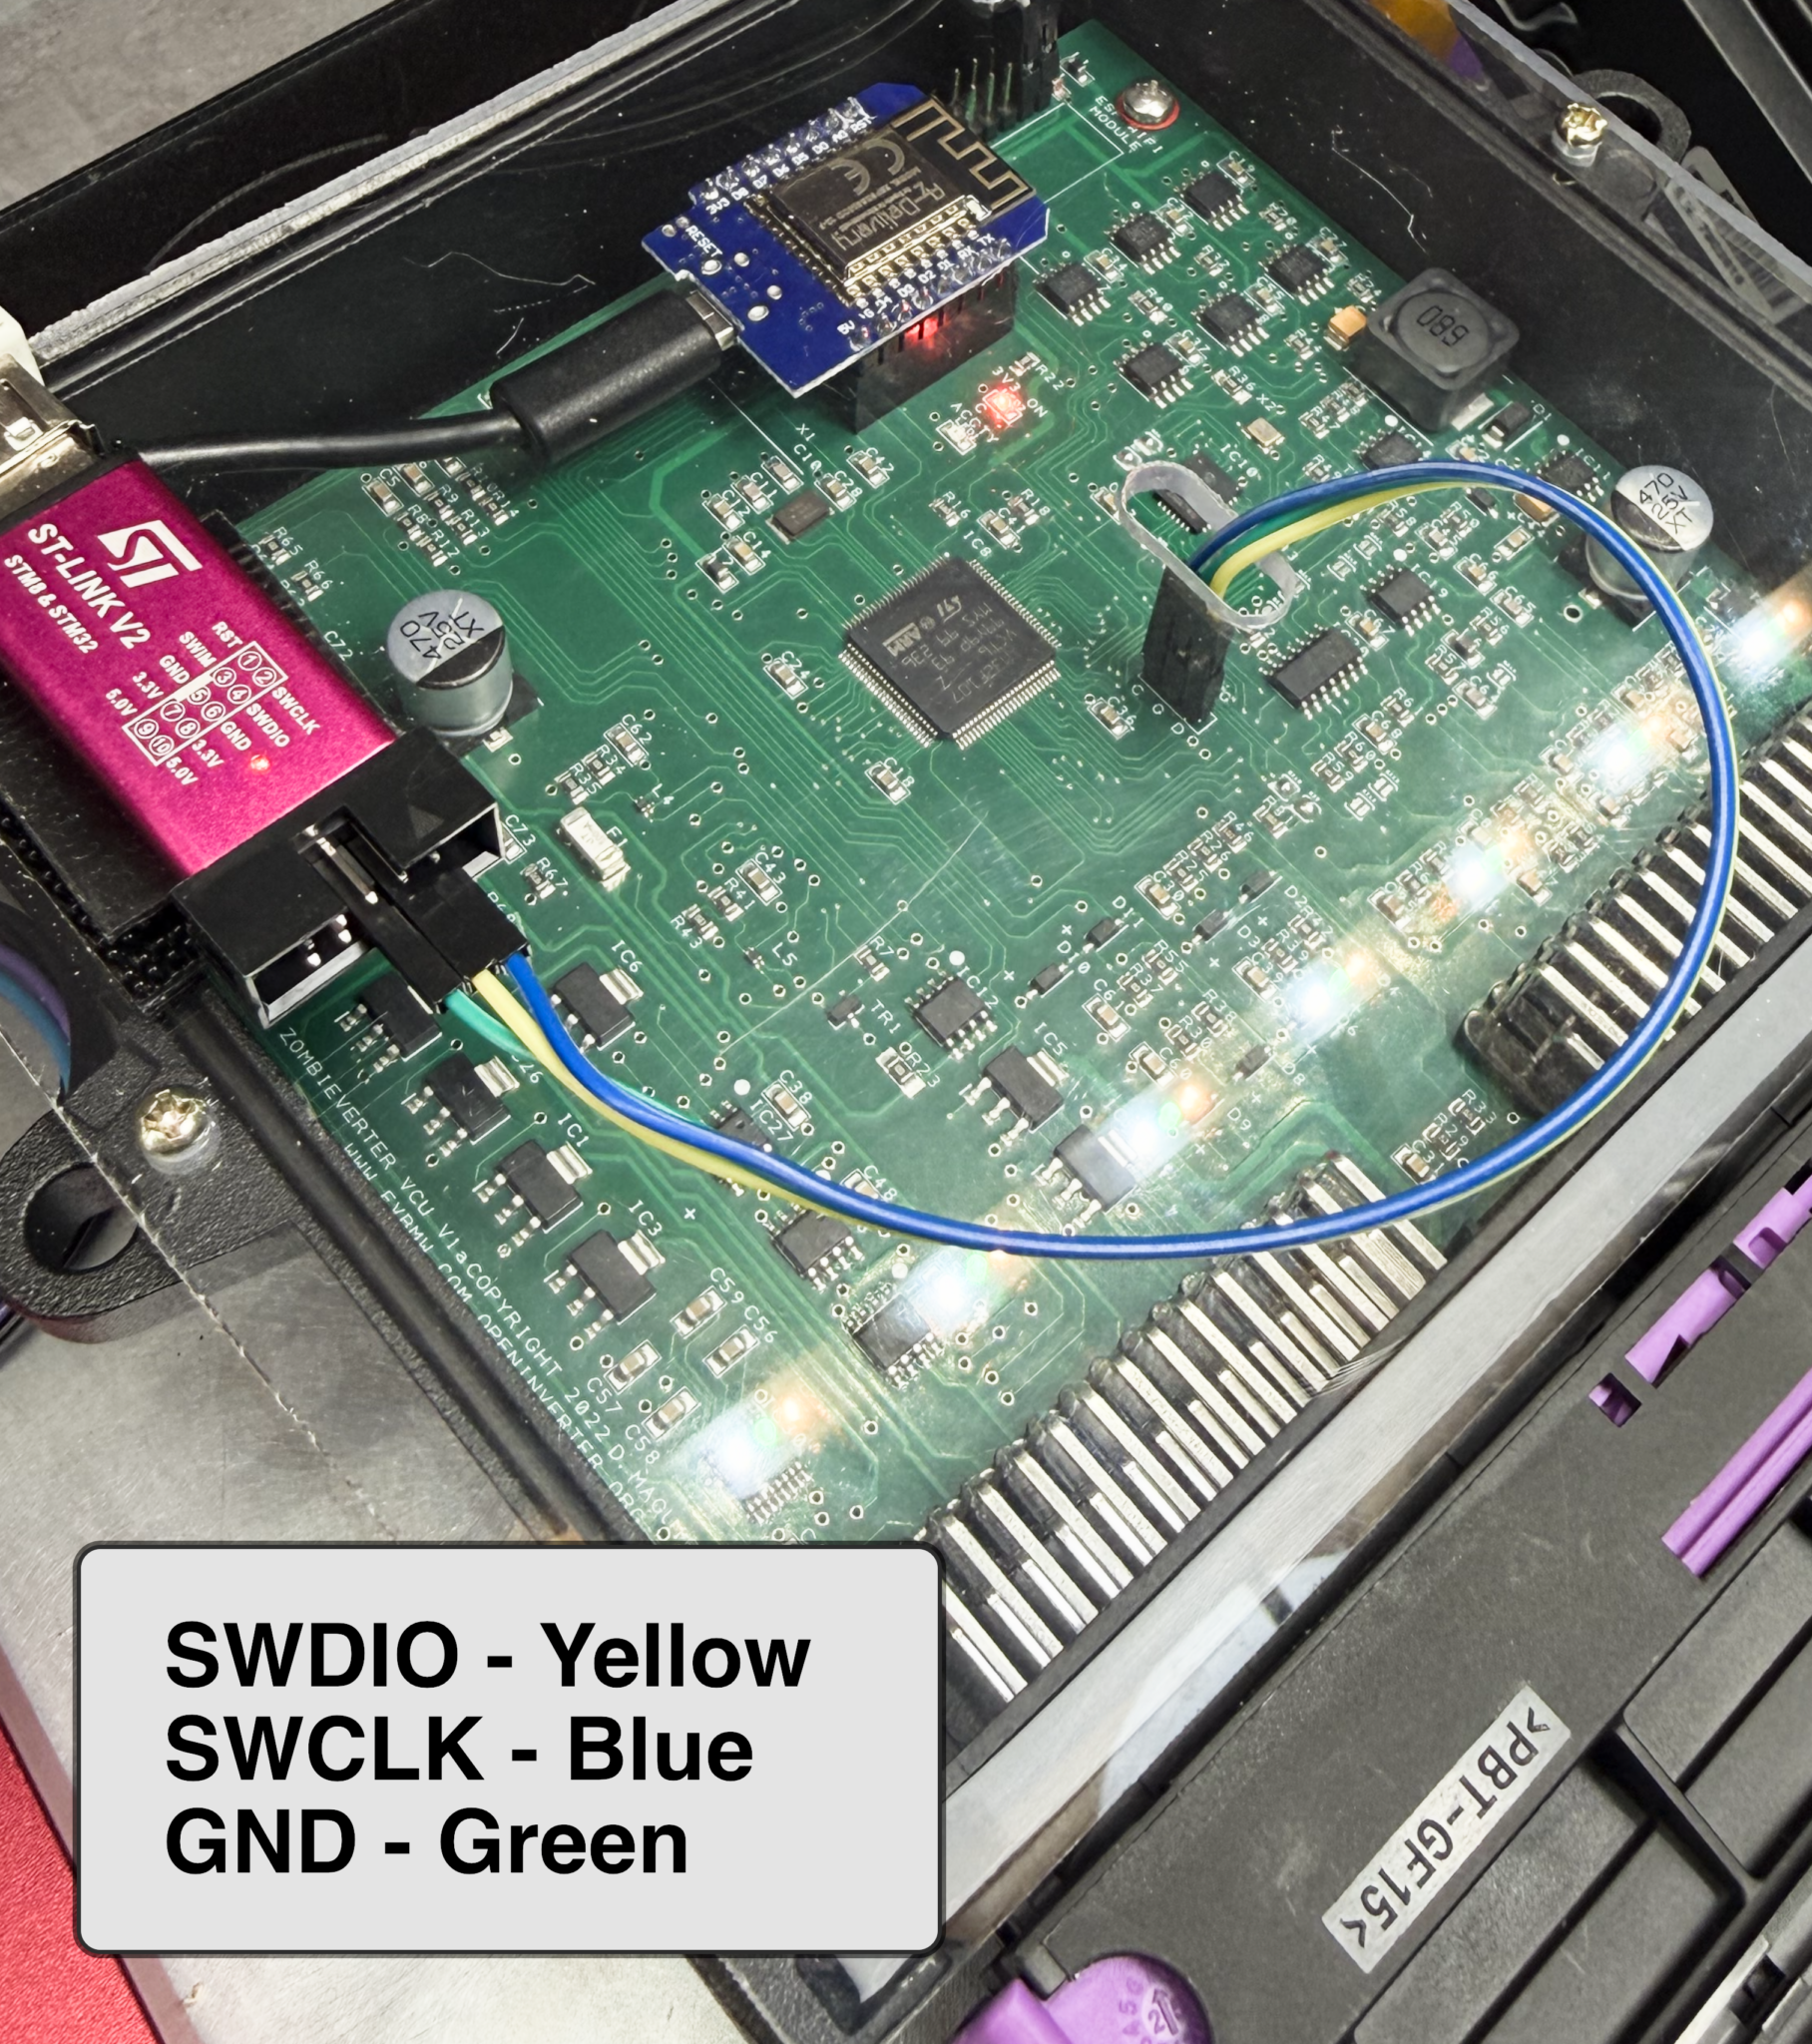
You can see in these two pictures that I’ve cobbled together a perspex top for the enclosure… to stop me dropping nuts, bolts, screwdrivers and a spanner or two onto the running board! 🙂
The ZombieVerter wiki entry talks about a red wire connected for power (ZombieVerter Programming), but for these cheap ST-LINK clone adapters there’s no need (I use these). If you’re using an official ST ST-LINK v2 (white puck) then you’ll need to also connect its VTref to a 3v3 somewhere on the ZombieVerter board. The ST adapter needs the VTref so it can decide what voltage levels to set its outputs to (5V, 3v3 etc).
A bit of a side note: I spent an hour or two trying to get the STM32 NRST reset signal working from the genuine ST-LINK, connecting to the chip side of the Zombie’s reset capacitor. In theory it should work but no matter what incantation of launch.json I tried from Visual Studio Code I couldn’t get the hard reset to work. I was hoping that would be a better way of entering and releasing debug mode, but… I couldn’t get it to work.
And with all the connecting and disconnecting the ST-LINK, I think I blew it up. At least it doesn’t work anymore. The LED comes on but it doesn’t blink to say it’s connecting to the PC. I think I may have got the clock and data lines reversed, not sure if that’s what did it, but more care needed in the future.
I’ll just have to put up with the cheaper clones… which anyway is no biggy if I’m going to be blowing things up a lot!
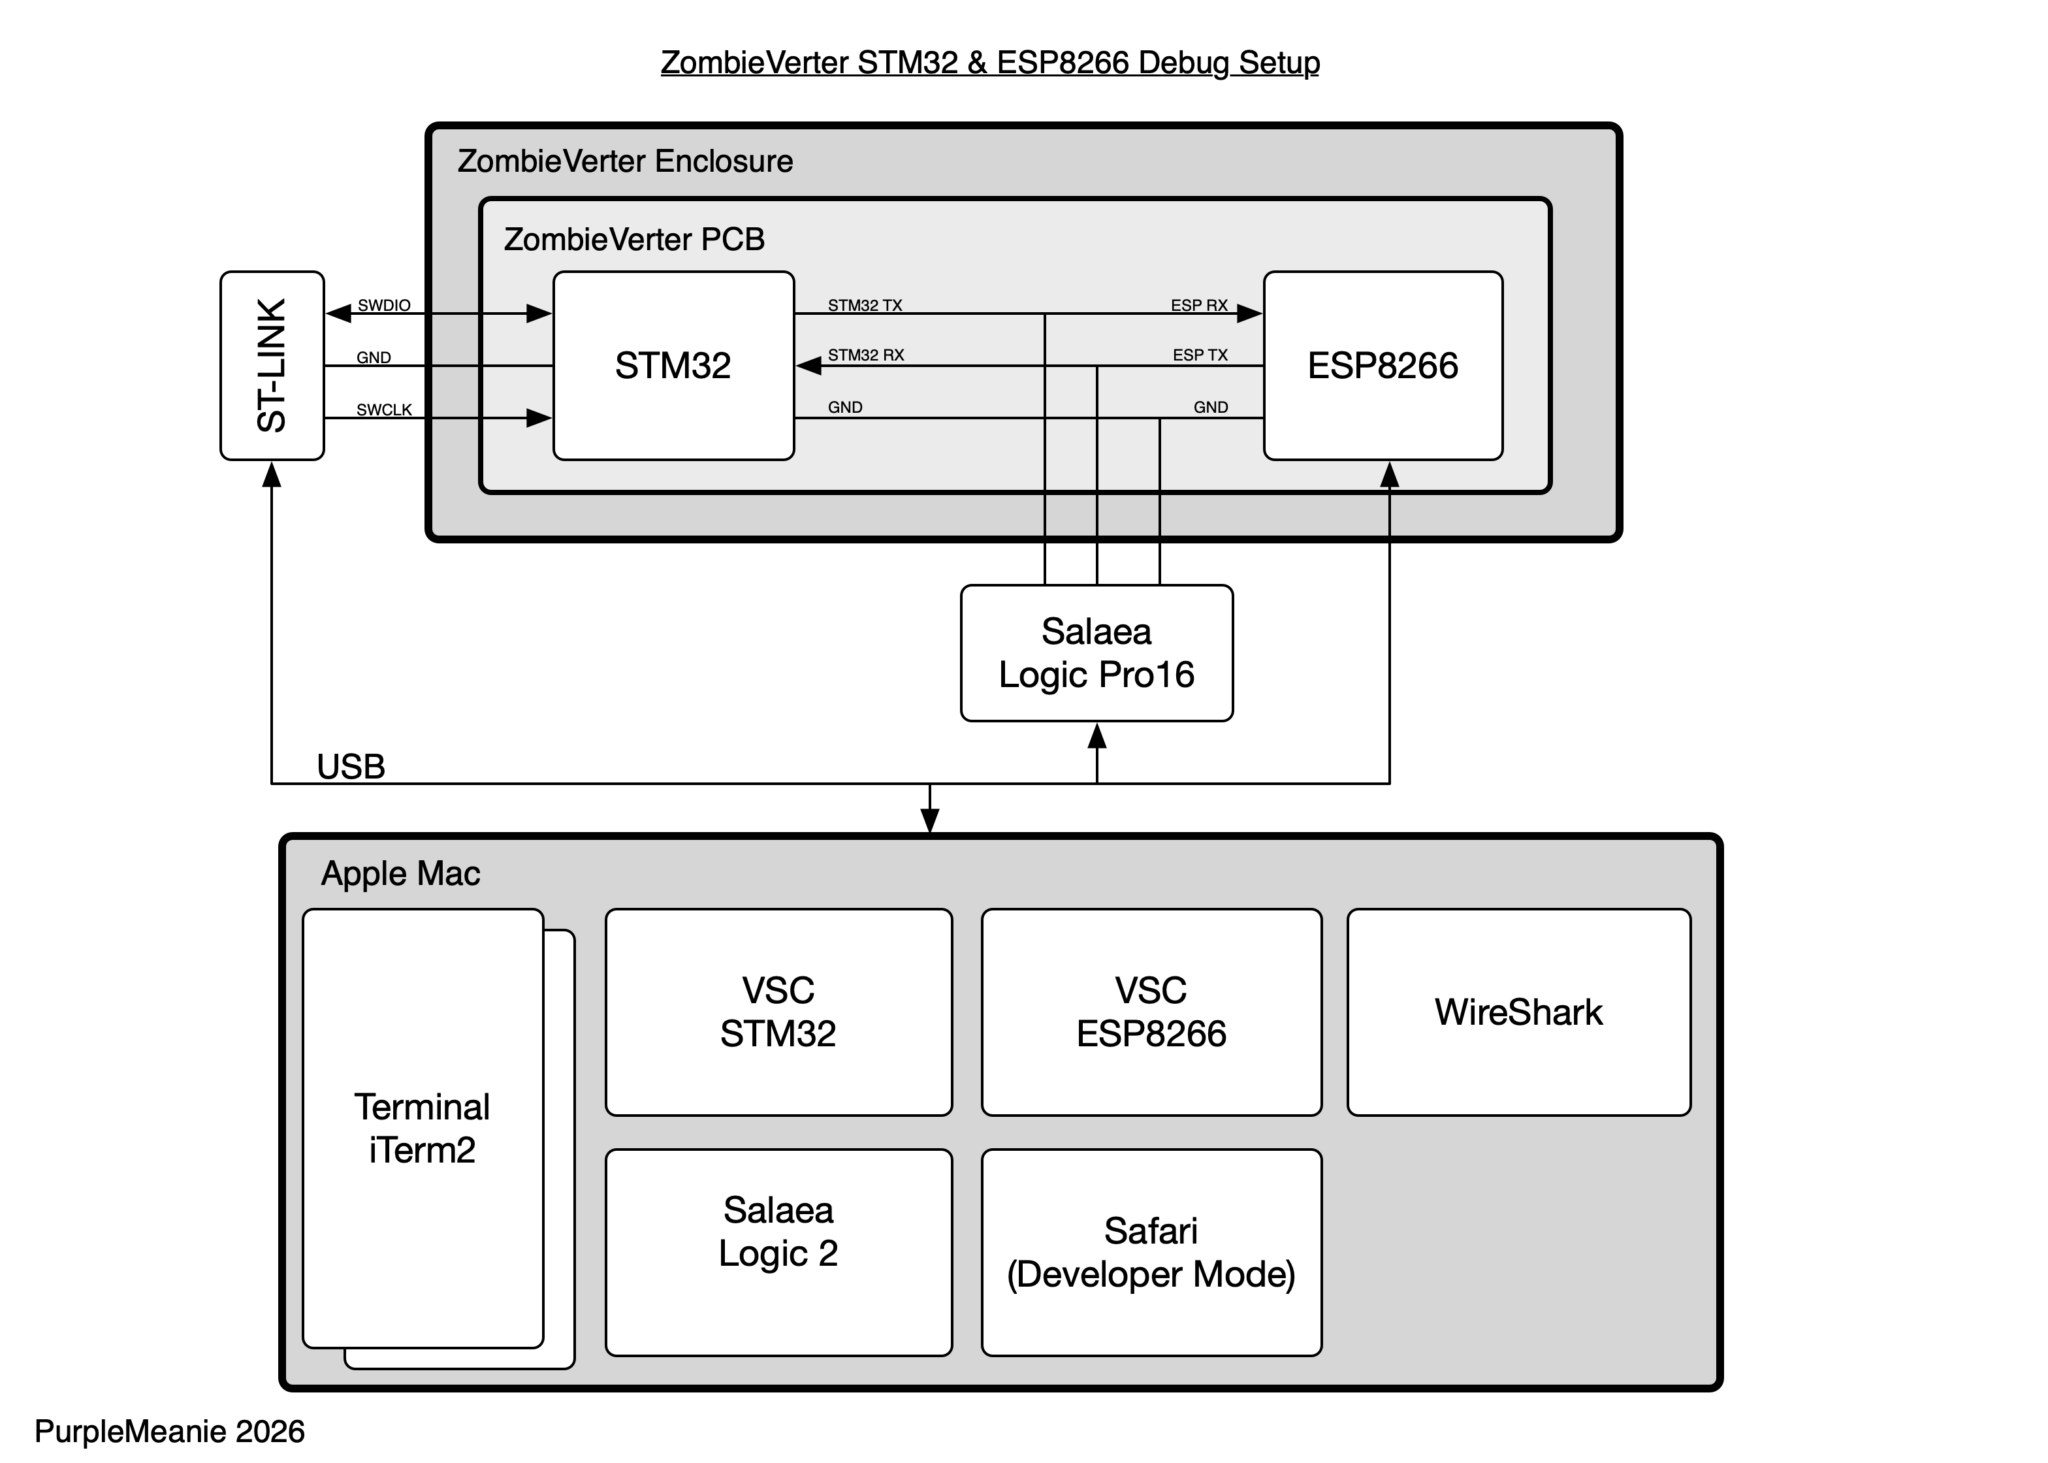
The Saleae Logic Analyser is simply connected to the Rx, Tx and GND using the top right connector on the Zombie PCB (as we look at it in those images).
Each of the Analyser, ST-LINK and ESP8266 Wemos boards are connected to my Mac over a USB cable (I use a 4-port USB hub near the test rig and run a 3m USB3 cable across my office to the Mac).
Visual Studio Code setup for ZombieVerter STM32f107 Debugging and Programming
First of all, it’s, I think, obvious, but I’m going to say it anyway… Debugging the STM32 on a ZombieVerter should be considered VERY VERY carefully.
You should absolutely NOT be suspending the STM32 execution in any ZombieVerter OpMode other than “off”… unless you know what you’re doing! At best you’re going to be simulating what your system does when the STM32 crashes, at worst you’re going to do a lot of very expensive damage to things like inverters.
With that out of the way, this is what I used to get Visual Studio Code debugging and programming a ZombieVerter:
- Visual Studio Code – duh
- OpenOCD
- Cortex-Debug Plugin
- Arm Toolchain
- Launch.json
- Tasks.json
- esptool.py or esptool
- mkspiffs
- arduino-cli
- The ZombieVerter code
This isn’t a full run through of what you’ll need to do, but if you’re into writing code for the ZombieVerter then you should know the steps to fill in here:
Visual Studio Code
There are loads of videos about how to get going on VSC, so I’m not going to cover the general setup here. But I will cover the STM32 and ESP8266 specific stuff later. There’s also a lot of code formatting and viewer plugins you’ll probably want, but VSC is pretty good at suggesting these as you open files up as and when you do so.
OpenOCD
OpenOCD is the Open On Chip Debugger. It includes the GDB (debugger) install and allows you to use the GDB backend on the STM32 processor to pause, breakpoint and inspect your paused code.
brew install open-ocdNote how this is open-ocd, not openocd… the cask name seems to have changed (remember, I’m talking about MacOS here).
Cortex-Debug Plugin
This plugin connects the OpenOCD command line tools to the Visual Studio Code debugger environment. From inside Visual Studio Code…
Install the cortex-debug plugin from Marus25.
Arm Toolchain
The ARM toolchain is what allows you to compile ARM64 code.
In theory you should be able to use the arm toolchain from either Homebrew or the default ARM toolchain. In the end there were some bits that seemed to be missing from the Homebrew install so I just went with the ARM default toolchain that installs into /Applications.
So I installed the MacOS (Apple Silicon) 15.2rel1 toolchain from:
https://developer.arm.com/downloads/-/arm-gnu-toolchain-downloads
ZombieVerter Code
Well then, if we’re going to be debugging code we better have it installed. The code comes in two chunks, the STM32 code and the ESP8266 code. Do this next bit wherever you want to be editing you code…
They can be installed with:
git clone --recursive https://github.com/damienmaguire/Stm32-vcu.git
And the webserver code you’ll need for the ESP8266 is:
git clone https://github.com/jsphuebner/esp8266-web-interface.git
That will create two folders containing the two code sets. I also created forks of each of those repos, but if you’re the sort of person that’s reading this then you’ll know how to do that too.
My forked versions can be found here (don’t expect them to be anything other than example code):
What I then do is open two Visual Studio code windows and have one folder in the two VSS windows (i.e. open VSS then do File -> New Window and in each window open one of the two folders from the git clone operations). That way you get two launch.json and task.json setups (see below) and that makes things easier to remember what’s what, IMHO.
It is possible to get one VSC window working on both cloned repos, but I find it helps to have two windows so it’s clear to me which one is connecting to either the STM32 or the ESP8266.
tasks.json
Now you’ve got some of the basic code installed you’ll need the magic to bring it all together:
- tasks.json
- launch.json
The first of these is a tasks.json. This a set of tasks described in a JSON format which can be invoked from within Visual Studio Code using shift-cmd-P -> Task Run. You then use one or more of these tasks to to build the ZombieVerter Stm32-vcu code.
Once you’ve got this tasks.json installed you won’t actually need to do a Shift-Cmd-P -> Task Run… You can do all of the building automagically from the launch.json which then invokes the tasks.json setup.
This is the tasks.json needed for the STM32 code window. You can either create this manually or get VSS to create it, the important thing is that this file (and launch.json) live in a sub-folder called .vscode.
{
    "version": "2.0.0",
    "tasks": [
        {
            "label": "Build stm32 VCU",
            "type": "shell",
            "command": "make",
            "options": {
                "cwd": "${workspaceRoot}",
                "env": {
                    "PATH": "/Applications/ArmGNUToolchain/15.2.rel1/arm-none-eabi/bin:$PATH"
                }
            },
            "group": "build",
            "presentation": {
                "echo": true,
                "reveal": "always",
                "focus": false,
                "panel": "shared"
            },
            "args": [
                "all"
            ],
            // Use the standard less compilation problem matcher.
            "problemMatcher": "$gcc",
        },
        {
            "label": "Rebuild stm32 VCU",
            "type": "shell",
            "command": "make",
            "options": {
                "cwd": "${workspaceRoot}",
                "env": {
                    "PATH": "/Applications/ArmGNUToolchain/15.2.rel1/arm-none-eabi/bin:$PATH"
                }
            },
            "group": {
                "kind": "build",
                "isDefault": true
            },
            "presentation": {
                "echo": true,
                "reveal": "always",
                "focus": false,
                "panel": "shared"
            },
            "args": [
                "clean",
                "all"
            ],
            // Use the standard less compilation problem matcher.
            "problemMatcher": "$gcc",
        },
        {
            "label": "Clean stm32 VCU",
            "type": "shell",
            "command": "make",
            "options": {
                "cwd": "${workspaceRoot}",
                "env": {
                    "PATH": "/Applications/ArmGNUToolchain/15.2.rel1/arm-none-eabi/bin:$PATH"
                }
            },
            "group": "build",
            "presentation": {
                "echo": true,
                "reveal": "always",
                "focus": false,
                "panel": "shared"
            },
            "args": [
                "clean"
            ],
            // Use the standard less compilation problem matcher.
            "problemMatcher": "$gcc",
        }
    ]
}
And here’s the launch.json that starts/stops a debugging session.
Note: I also choose to build the code every time… just to make sure the symbols are up to date…. I hate chasing my tail with stale symbols!@
Launch.json
{
	"version": "0.2.0",
	"configurations": [
		{
			"name": "Launch (Build, Flash and Attach)",
			"type": "cortex-debug",
			"request": "launch",
			"servertype": "openocd",
			"cwd": "${workspaceFolder}",
			"executable": "${workspaceFolder}/stm32_vcu",
			"device": "STM32F107VC",
			"configFiles": [
				"interface/stlink.cfg",
				"target/stm32f1x.cfg"
			],
			"svdFile": "${workspaceFolder}/STM32F107xx.svd",
			"preLaunchTask": "Build stm32 VCU",
			"openOCDLaunchCommands": [
				"adapter speed 1000"
			]
		},
		{
			"name": "Attach - make sure elf matches target",
			"type": "cortex-debug",
			"request": "attach",
			"servertype": "openocd",
			"cwd": "${workspaceFolder}",
			"executable": "${workspaceFolder}/stm32_vcu",
			"device": "STM32F107VC",
			"configFiles": [
				"interface/stlink.cfg",
				"target/stm32f1x.cfg"
			],
			"svdFile": "${workspaceFolder}/STM32F107xx.svd",
			// "preLaunchTask": "Build stm32 VCU",
			"postStartSessionCommands": [
 				 "continue"
			],
			"openOCDLaunchCommands": [
				"adapter speed 1000"
			]
		}
	]
}
A couple of points here. I probably need to spend more time on this, but the “Attach only” options were struggling without doing a preLaunch build. I need to come back to that.
You’ll also need another file here, the STM32F107xx.svd. This is downloaded from a generic repository and once that’s unzipped I copied the .svd file into the workspace folder.
You can also play with the ST-LINK adapter speed settings. I’ve had good success at up to 4000 (4MHz) but a more conservative 1000 seems to do everything I need.
The two config files (stlink.cfg and stm32f1x.cfg) come from the openocd install and are relative to that install location, so as long as you’ve got openocd installed then the files should be found.
Ok, so now I’ve got a setup that can build, run and debug the STM32 code. Breakpoints and code inspection once paused worked well from inside VSC.
What about the ESP8266 code?
ESP8266 Code Setup
While I could build and debug the STM32 code from within VSS, I haven’t got quite so far with the ESP8266. So at the moment I just edit the code in VSC and do the building and reflashing from the command line.
This could all be done from the Arduino IDE, but I prefer VSC AND… I prefer VSC 🙂
First though we need the Arduino command line tools and some way to flash the device:
brew install arduino-tools
and also
brew install esptool
My Arduino sketch build from the command line, doing the ESP8266 code is:
arduino-cli compile -v --fqbn esp8266:esp8266:d1_mini esp8266-web-interface.ino --build-path ./build
Floating the STM32 to Program the ESP8266
- Pause the STM32 from within the VSC STM32 debugger (obviously having run the code to start with)
- From the VSC debug console:
- source tools/float_uart3.gdb
- flash the ESP8266 board
- From the VSC debug console:
- source tools/restore_uart3.gdb
- Restart the STM32 from VSC
To flash the ESP8266 from the command line I use:
curl -F 'data=@/data/ui.js' http://10.0.1.20/edit
git clone --recursive https://github.com/igrr/mkspiffs.git
path-to-mkspiffs-build-dir/mkspiffs -c data -b 4096 -p 256 -s 0x100000 spiffs.bin
That gets us a filesystem in a .bin, now we can load it into the right place on the device:
ESP8266 Debugging
Now we can change code on the ESP8266, next up was to add some logging to the ESP8266 to see why I’m getting the red communication banner.
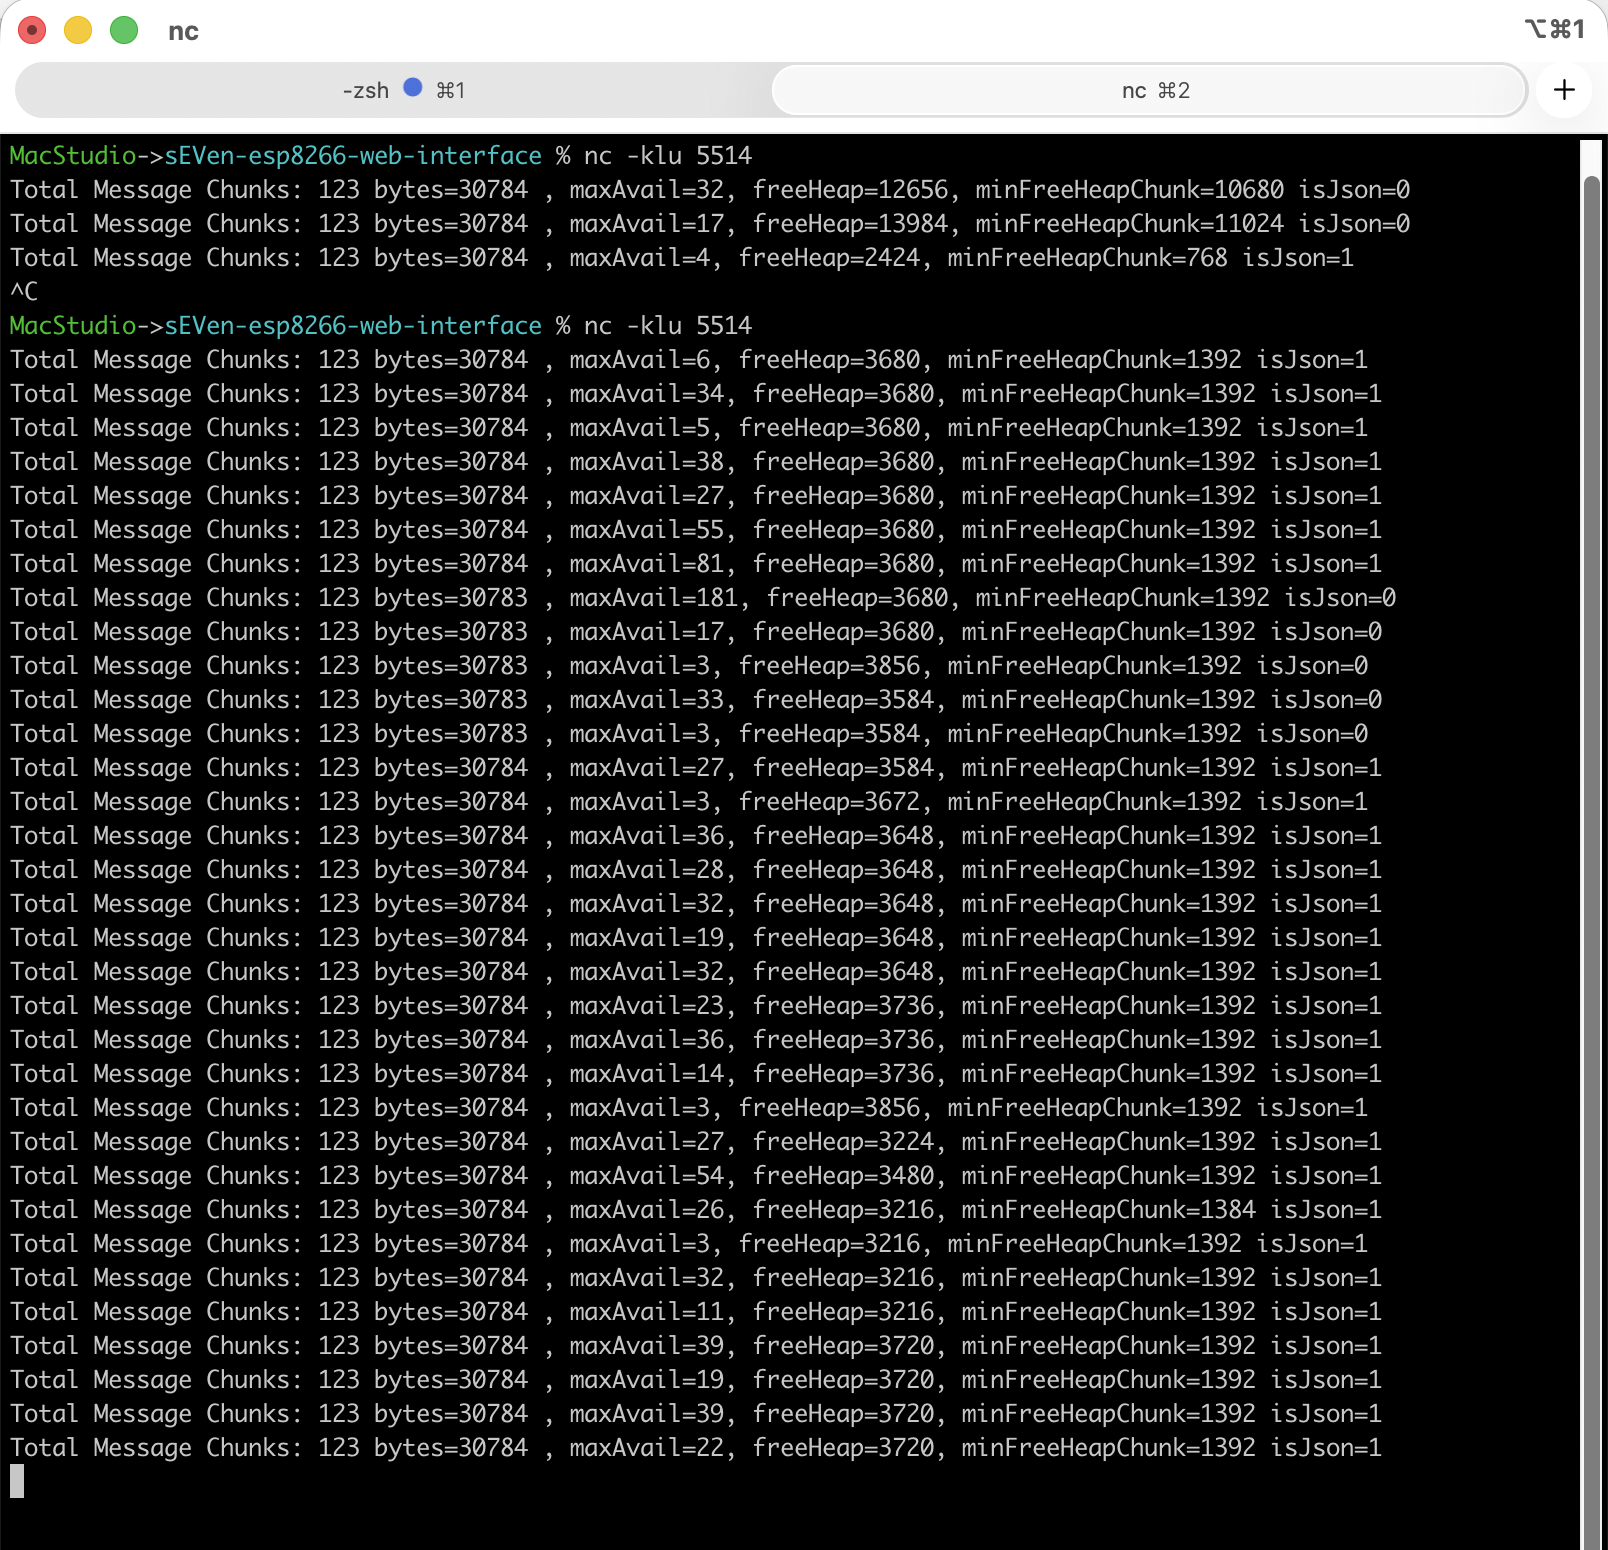
Because the ESP8266 Wemos D1 Mini board share their USB and breakout pin serial ports, there’s no way of getting any Serial printf debugging out of the board while the ESP8266 is talking to the STM32. My solution was to add some simple UDP logging into the ESP8266 code…
#include <WiFiUdp.h>

WiFiUDP logUdp;
IPAddress logIP(10,0,1,6);   // <-- your Mac IP
const uint16_t logPort = 5514;

void logf(const char* fmt, ...) {
  static char buf[256];
  va_list ap;
  va_start(ap, fmt);
  int n = vsnprintf(buf, sizeof(buf), fmt, ap);
  va_end(ap);
  if (n <= 0) return;

  logUdp.beginPacket(logIP, logPort);
  logUdp.write((const uint8_t*)buf, (size_t)min(n, (int)sizeof(buf)-1));
  logUdp.endPacket();
}
Later on, I realise that, even though the UART is shared between the STM32 and the host PC, I could actually just to Serial.printf() from the ESP8266 code, while the json stuff was also happening. This wouldn’t be ideal in production, seeing as the serial printf’s might affect the json timing, but in the end it never seems to have caused any problems in my few weeks of testing doing this.
Testing Signals on the Wire
Ok, now I’ve got a framework for debugging, I wanted to check that the JSON coming into the ESP8266 was valid.
The JSON code on the ESP8266 is structured to use a char* buffer to accept packets of up to 256 bytes in from the UART. It then appends that buffer to a C++ String object.
The problem with that on the ESP8266 is that this sort of object is a bit of a heap monster. The JSON objects getting thrown around here are about 30kB. And the ESP8266 has only a small amount of RAM for stack and heap usage (ESP32 will fix this too). While the C++ String control block is created on the Stack, behind the scenes the ESP8266 Arduino runtime uses malloc and free to implement the String storage. And so when every 256 bytes come into the Arduino sketch code it needs to malloc a new chunk of contiguous memory and then free the old one. But with all the other stuff going on on the chip (Wifi and Web Server) the heap is going to be pretty scrappy and may not have space for a 30kB chunk. Heap Fragmentation.
So I did some code to check if the String object did or did not have valid JSON in it (it was possible that the corruption was happening further on in the transmission over the Wifi, so I wanted to see if the JSON coming into the Arduino sketch was ok). It wasn’t.
The code below does a simple brace matching algorithm and I could output whether each JSON message was valid into my UDP logger. Whenever I saw the Web Browser fail to load JSON (Red Banner) I also saw my brace matcher say there was corrupted JSON.
So, my problem is getting JSON into the Arduino sketch.
bool looksLikeValidJsonStructure(const String& s) {
  int depth = 0;
  bool inString = false;
  bool escape = false;
  bool started = false;

  for (size_t i = 0; i < s.length(); i++) {
    char c = s[i];

    if (!started) {
      if (c == '{' || c == '[') {
        started = true;
        depth = 1;
      } else if (c > ' ') {
        return false; // non-whitespace before start
      }
      continue;
    }

    if (escape) { escape = false; continue; }

    if (inString) {
      if (c == '\\') { escape = true; continue; }
      if (c == '"') inString = false;
      continue;
    } else {
      if (c == '"') { inString = true; continue; }
      if (c == '{' || c == '[') depth++;
      if (c == '}' || c == ']') {
        depth--;
        if (depth == 0) {
          // after closing root, only whitespace allowed
          for (size_t j = i + 1; j < s.length(); j++) {
            if (s[j] > ' ') return false;
          }
          return true;
        }
        if (depth < 0) return false;
      }
    }
  }

  return false; // never closed root
}
And here’s some sample logging, isJson=0 showing the brace matching failing.
On the Wire Testing
Right, so the JSON coming into the Arduino sketch is corrupted. Note that I’m not saying it’s corrupted coming into the ESP8266 itself, we’ll get to that in a bit.
So next up I wanted to check if the STM32 was sending valid JSON messages… and that meant breaking out the logic analyser.
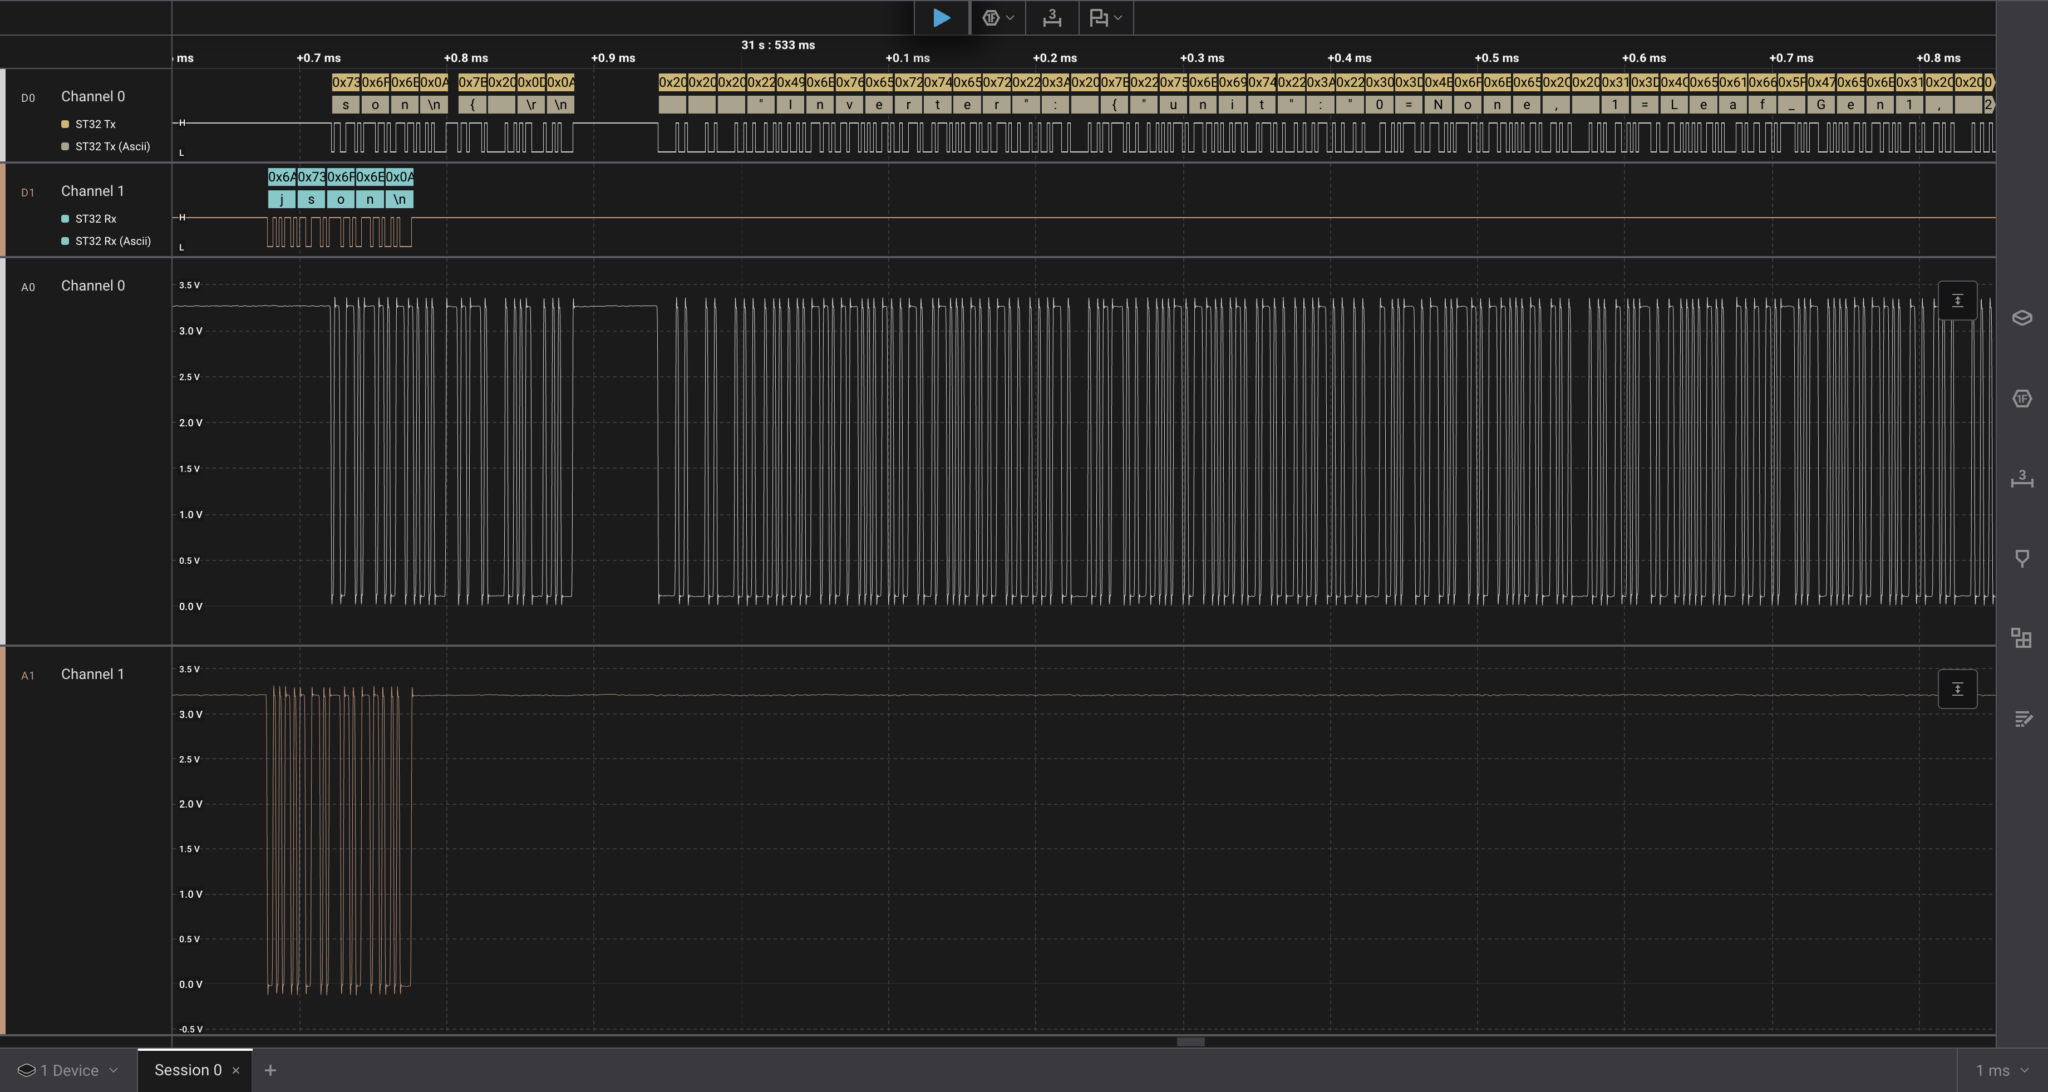
With my Salaea hookup up to the STM32/ESP8266 UART Rx and Tx I could easily grab the 500kbps traffic on the wire. The Salaea Logic 2 software has protocol disectors for a bunch of protocols (and of course serial is about as simple as they get) so it was easy to decode the serial 1’s and 0’s into hex and ascii. I could then export the hex to a .csv file from the Salaea software and some simple Python to turn that back into a text file containing all the JSON messages.
Eagle eyed amongst you will see that in the image above, the STM32 echo of the json command from the ESP8266 is missing the first character – it should say “json” but just says “son”. So I’ll need to go and check why that echo is munching the first echoed character. Problem for future John!
Here’s the simple Python to take the Salaea CSV file and convert it to a flat text file.
#!/usr/bin/env python3

import sys
import csv
from pathlib import Path

def main():
    if len(sys.argv) != 2:
        print(f"Usage: {sys.argv[0]} <input.csv>")
        sys.exit(1)

    csv_path = Path(sys.argv[1])
    out_path = csv_path.with_suffix("").with_name(csv_path.stem + "_columnB.txt")

    chars = []

    with csv_path.open(newline='', encoding='utf-8') as f:
        reader = csv.reader(f)
        next(reader, None)  # skip header row

        for row_num, row in enumerate(reader, start=2):
            if len(row) < 2:
                continue

            value = row[1].strip()

            if value.startswith("0x"):
                try:
                    byte = int(value, 16)

                    if byte == 0x0D:
                        chars.append("\r")
                    elif byte == 0x0A:
                        chars.append("\n")
                    elif 0x20 <= byte <= 0x7E:
                        chars.append(chr(byte))
                    else:
                        chars.append("?")

                except ValueError:
                    print(f"Warning: invalid hex value '{value}' on row {row_num}")
                    chars.append("?")

    with out_path.open("w", encoding="utf-8", newline="") as f:
        f.write("".join(chars))

    print(f"Wrote {len(chars)} characters to {out_path}")

if __name__ == "__main__":
    main()
All of which showed no corruption of the JSON on the wire. All the JSON messages from the logic analyser captured UART traffic were whole and valid. No corruption there.
So at the same time that I could see the UDP logging was indicating corruption there, the data on the wire was ok – I tested a few hundred JSON messages and all were good. So at least that rules out any issues on the PCB or indeed with the transmission out of the STM32.
Transmission Speeds
One other side show was to see if the speed of the UART comms coming into the ESP8266 was causing the problem – I suspect it is, but which bit of the chain of events does that relate to. If the STM32 is sending good JSON on the UART Rx/Tx but the ESP8266 Arduino sketch is not receiving it then perhaps the STM32 DMA driven UART is driving the ESP8266 harder than its polled UART can receive (again ESP32 DMA UARTS would fix this).
So, just lowering the data rate might solve the problem, and it sort of did, for a while, but why… and how can I get the transmission back up to where it should be if I don’t get to the root of the problem.
So I changed the ESP8266 and STM32 code to allow me to send an altered “fastuart” command (as well as the JSON messages the protocol between the browser client, ESP8266 and STM32 allows for other data and commands).
The new fastuart command allows me to send a specific baudrate to both the ESP8266 and the STM32, synching their uart speeds and allowing me to test different rates… the original code allowed a couple of speeds to be selected, but I wanted more granularity.
And slowing things down did work. To a point. There were still problems even at slower rates. And with those slow rates it took ages for the web interface to update. Transferring 30kB at 115200 takes over 2 seconds, so my interface isn’t showing VCU mode changes or voltages/current very quickly after they change… and in fact at those rates I miss a lot of what’s going on with the VCU.
Where does that leave me (updates to come later)?
Well, I suspect the problem relates to the ESP8266 hardware fifos. The chip is a pretty low powered device to be running a webserver and wifi stack. There are alls sorts of tasks that the web server and wifi could be doing that would hold off the rest of the processor from doing other things.
And the ESP8266 input fifo’s are only 128 bytes. Which at 500,000bps is around 2.5ms before the 128 bytes fill up. So if the web server or wifi hold off other tasks for longer than that then data will be lost on the UART RX.
This could have been mitigated by hardware flow control (RTS/CTS) but the STM32 on the ZombieVerter uses those hardware pins for other things, and its just not going to get fixed or even jury rigged to test out, any time soon.
Other options are to try and port the webserver Arduino code to something with a bit more grunt. Say an ESP32-C or S. My money is on doing it with an S. Which has dual cores and the standard web server implementation works on the second core, leaving the first core to worry about servicing the UART. But that’s a lot of work that I wasn’t planning to do.
Why’s this affecting me? I suspect my Wifi is rather clogged and either the ESP8266 is not picking a good channel to work on (I tried this all out with both the inbuilt access point and connecting to my office network SSID) or retransmissions on the wifi network are causing processor starvation for UART servicing. I certainly see retransmission requests with Wireshark when I look at the traffic coming into the client browser. Maybe a different Wifi stack (ESP32-S) might be better at handling that sort of problem.
And that’s all for this ramble. Hopefully I’ll figure out what’s going on and include it here, or at least put a link to a new post here instead.
Update (Feb 2026)
Ok… so I think I have this nailed… after a week or more of further work from that described above AND two more weeks of testing where I haven’t seen a Red Banner at all.
So we’ve already got two fixes up our sleeve that I think helped. Moving to a Wemos D1 mini clone that could actually do 160MHz, and slowing down the UART speed. Both of which may or may not be required with once I got the following fixes in place.
Chunking
After seeing that the JSON was not getting into the Arduino sketch code correctly, there’s a few more things that could be going on. We already talked about Heap Fragmentation, and that could be fixed by removing the use of a C++ String (concatenating 256byte buffers up to 30kB) and sending each 256 byte buffer off to the web client as a stream.
So I did a bunch of chunking code to send each buffer out, just for the json. ChatGPT helped a lot with that 🙂
And this did make a difference. Things got more reliable, but the red banners were still occurring from time to time.
UART Buffers
The ESP8266 UART drivers use a set of input FIFO’s to buffer any data coming in. I was concerned that the webserver was hogging CPU time (especially in ISRs) and these fifo’s were overrunning.
Now there’s two sets of FIFO’s at play here. There’s a hardware Rx fifo and a software driver Fifo.
The software Fifo sits in-between the hardware fifo and the Arduino sketch code.
So, there’s also a smaller 28byte hardware fifo in the ESP8266 but I checked the hardware fifo overrun flags and they weren’t firing, so the hardware was being drained quickly enough – i.e. the UART ISR was running often enough and was filling the software fifo’s.
But I also put debug code into each Aruduino Sketch UART read and found that the software fifo’s were filling. So I bumped them up to 4096. That helped a lot… but they were still overflowing from time to time and showing Red Banners.
Wifi Stack
So next up I had to figure out what was causing those software fifo’s to overflow. The only way that could happen is if the Arduino sketch code was being held off from running and not draining the fifo’s.
The only real culprit there was going to be the web server.
And because this is a relatively simple web application my assumption was that there was probably something going on at the Wifi level – causing Wifi resends and holding everything up while that could happen.
So I started to look at the Wifi stack… and realised that something that had been bugging me since day one was probably an error and not by design…
Namely that the wifi stack was running as both an Access Point AND a Station (connecting to a remote access point) at the same time.
Now, the ESP8266 wifi stack can absolutely do this. It can run with both access point modes running at the same time. BUT with one restriction… when you start the stack it creates an access point for other devices to connect to and concurrently searches for an access point to connect to (if you have that second mode configured). But once the stack connects as a Station to another Access Point, the inbuilt Access Point sets its Wifi channel to whatever the remote Access Point wants to use.
So… you end up broadcasting an Access Point to connect to AND connected to a remote Access Point BOTH ON THE SAME WIFI CHANNEL.
And that’s what I think was causing all my problems. There were two things going on there… the broadcasting of an Access Point on the same channel that my LinkSys Wifi 6 nodes wanted to use was causing them all sorts of problems. At one point this Wemos D1 board seemed to take out the whole of my Wifi in my office. Whether that board and my Wifi routers were chasing each other around the Wifi channels or it was just swamping my network, I don’t know. But nothing in my office would connect to Wifi until I turned off the Wemos D1 clone. And even without that chasing problem, I suspect the two wifi systems transmitting on the same channel was interfering and introducing transmission errors – causing the ESP8266 stack to hog the processor at times.
With that thought in mind, I could see that the esp-web-server code is supposed to boot up with the inbuilt Access Point mode enabled and move to Station mode (connecting to another access point). Then when Station mode is established its supposed to drop the Access Point mode and leave just Station Mode.
Well, that wasn’t working on my install. The code is in there to do this with a Ticker object but it wasn’t working for me. But that code was also just a one way street if the remote Access Point dropped after going to only Station mode, then the board wouldn’t re-instigate an Access Point mode.
So, I dropped in a whole raft of over-engineered backoff and retry code that can fall back to Access Point mode and retry Station Mode after various timeouts. And critically drops the Access Point mode when Station mode is working. Overkill for sure… but it worked.
With all of these fixes in place (that I’ll list again in a minute) my install is now totally rock sold. It’s been working now for two or three weeks with no Red Banners. Perhaps some of the fixes I put into place are redundant now, but I’ve got other things to get on with now and perhaps I’ll get back to investigating what really fixed it at a later date. But if I do come back to this then I’ve got some ESP32-S3 board to be trying – they’ll fix the shared UART issue, increase the processor speed even more, give more heap space and allow for multi-processor threading… way over the top, but hey what-fun!
So in the end I’ve implemented the following fixes:
- Reduced the UART speed from ~921kbps to 500kbps
- Increased the software fifo’s to 4096bytes
- Implemented a chunking algorithm to send the ~30kB json traffic over the Wifi
- Created a back-off/retry mechanism with definite drop of the AP mode for the Wifi stack
All of those in their own right made some difference. And I suspect the biggest issue was the last. However, even with just the last change, I suspect there would have still been cases where Red Banners were seen – all be it less often. With all these fixes I think the connection is pretty solid now.
My next thing to try is to increase the UART speed back up again and see if I can speed up that connection at bit and make the Webserver cycle time a bit snappier again.
(But then I may just go and do the ESP32-S3 thing and forget about the ESP8266 once and for all).
I’ll publish my esp8266-web-server fork here when I’ve got around to tidying it up and pushing my changes back to it, you can find it here anyway…
https://github.com/Purplemeanie/sEVen-esp8266-web-interface.git
So that was probably two or three weeks of very little progress doing anything else. There’s a couple more projects I’ll write up in the next few posts that also meant I did very little actual EV work and was just getting my ducks in a line so I had a robust debug environment (Wireshark dissector and an ESP32-S3 Canbus Sniffer using ESP32RET).
That’s it for now… happy blatting.

Leave a Comment